
Backtest
Backtesting forms a critical part in the tuning of our forecast, especially in understanding how various factors ultimately create price volatility. In order to validate the quality of this backtest, we focused on assessing our performance in four main areas:
- Raw prices
- Daily price shape
- Spreads
- Value of volatility
Raw Prices
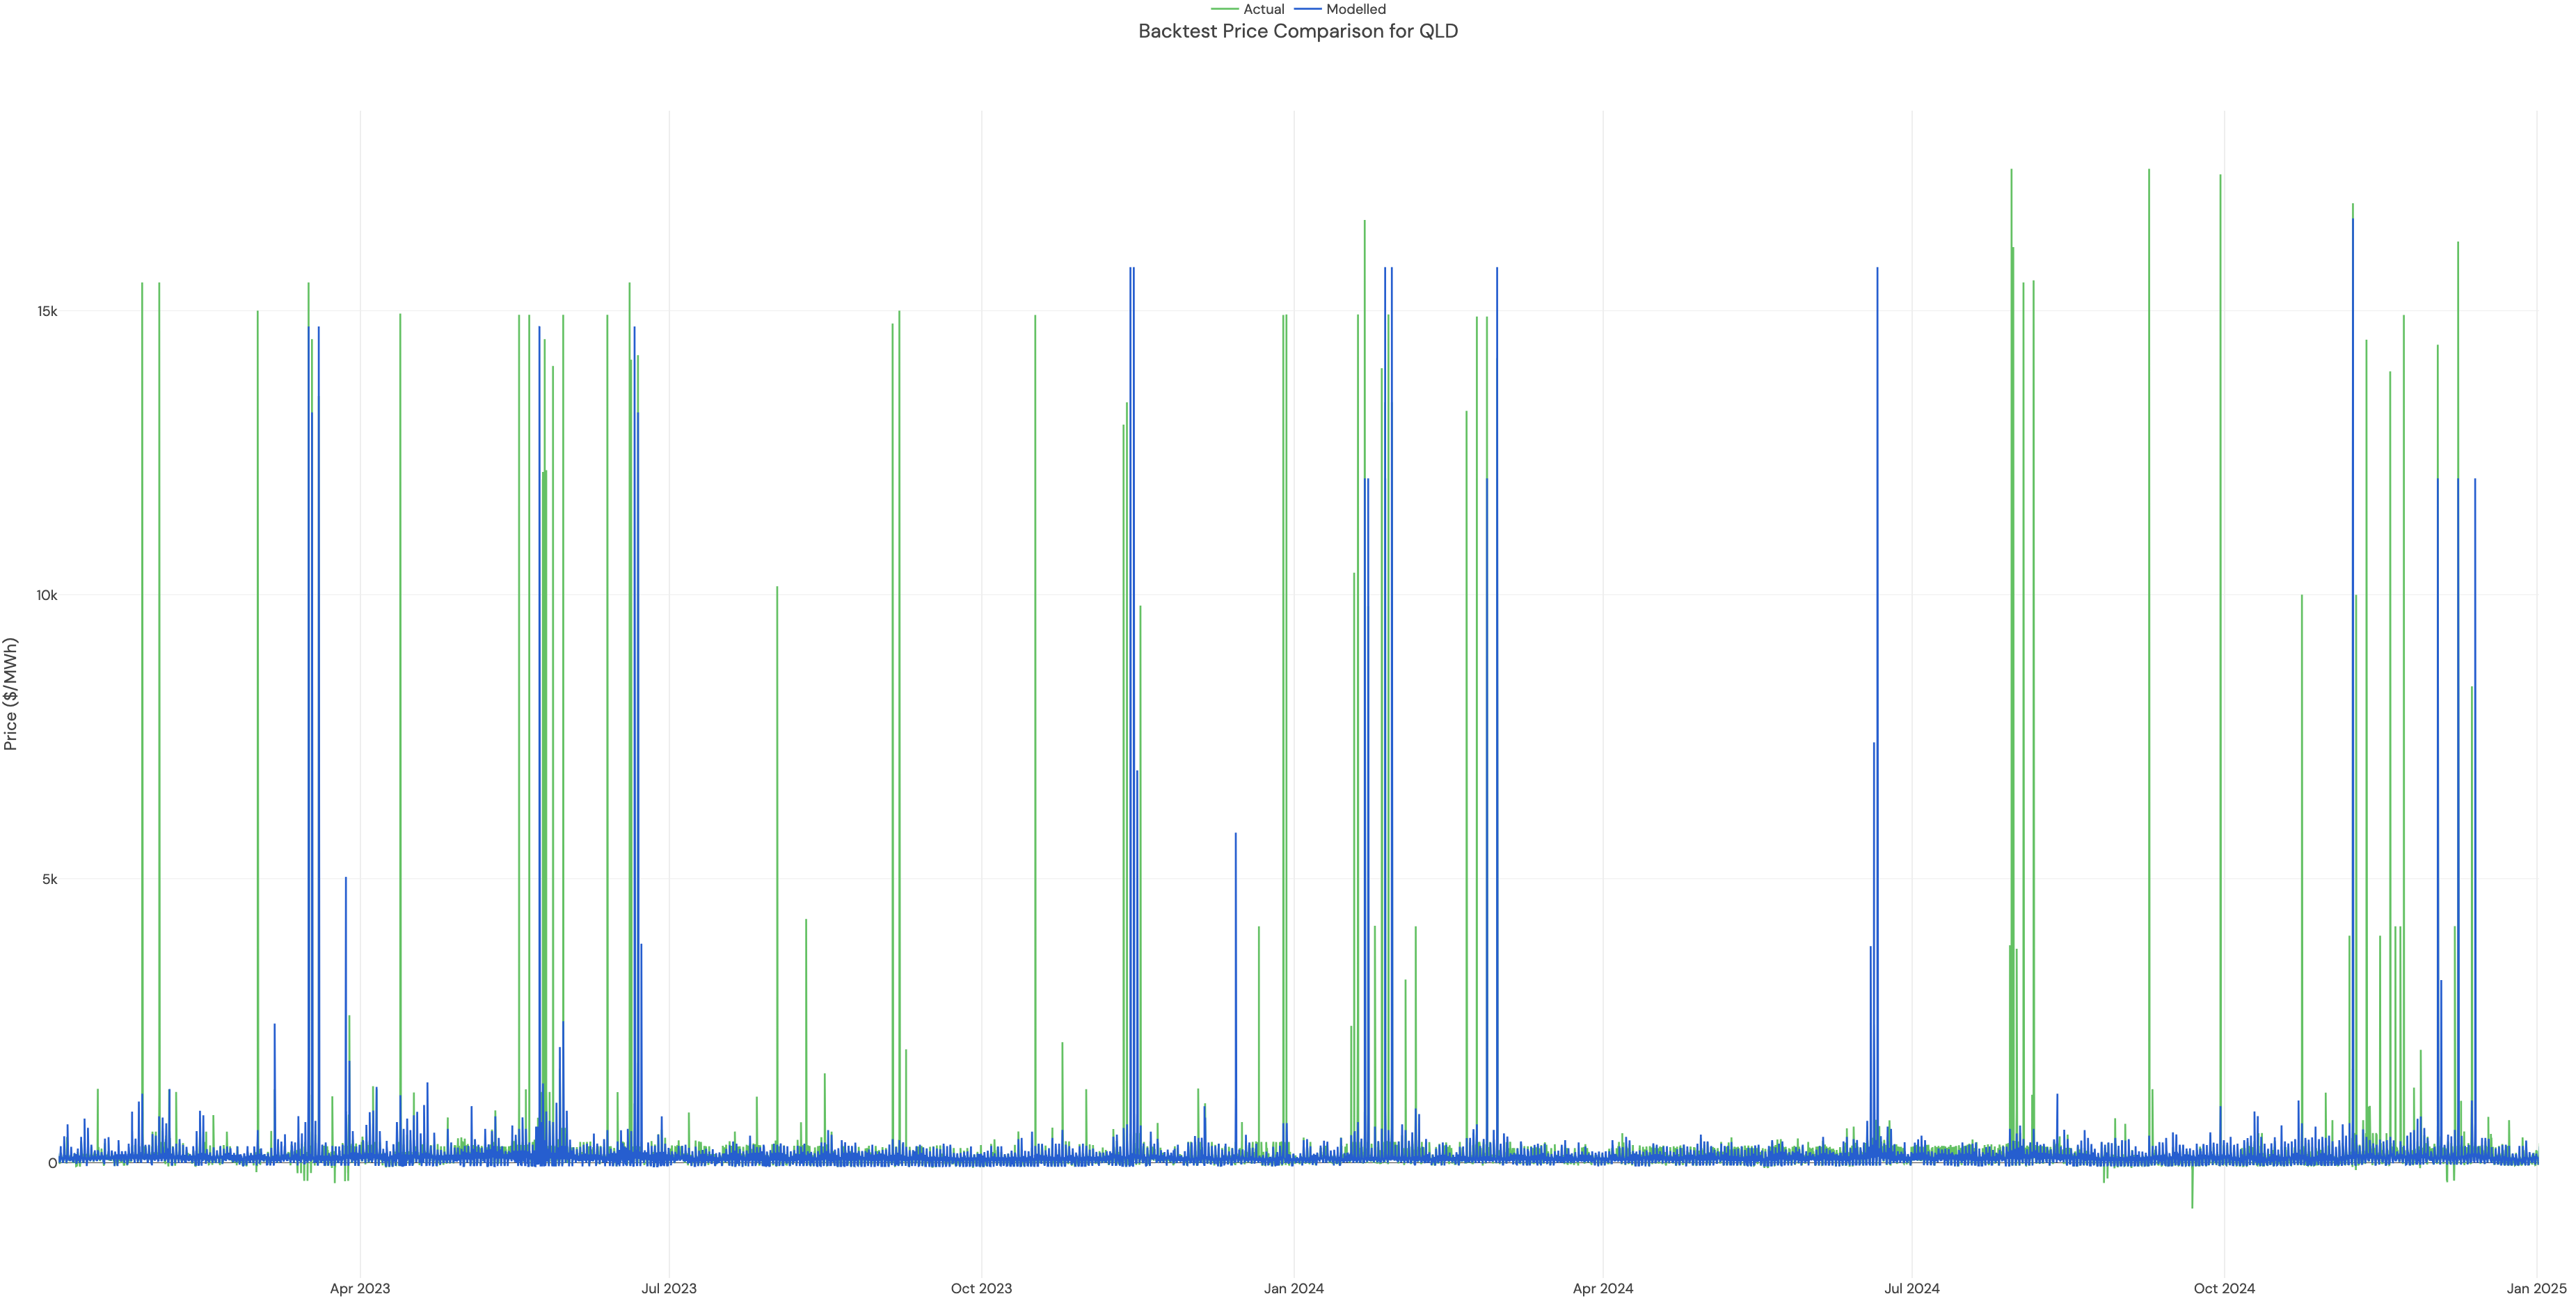
Raw prices are the easiest way to quickly evaluate all of the above criteria. Below you can see our backtest of all prices at 5 minute granularity in Queensland in 2023 and 2024. The main thing this makes clear is that our model is producing an appropriate number of price spikes, and they are often in the right places. It it impossible for all price spikes to end up in the right place, as they can be heavily tied to human behaviour in how bids are placed, especially with portfolio bidding. What is more important is for the backtest to have the right amount of 'volatility value', which we measure below.
Raw Prices (zoomed in)
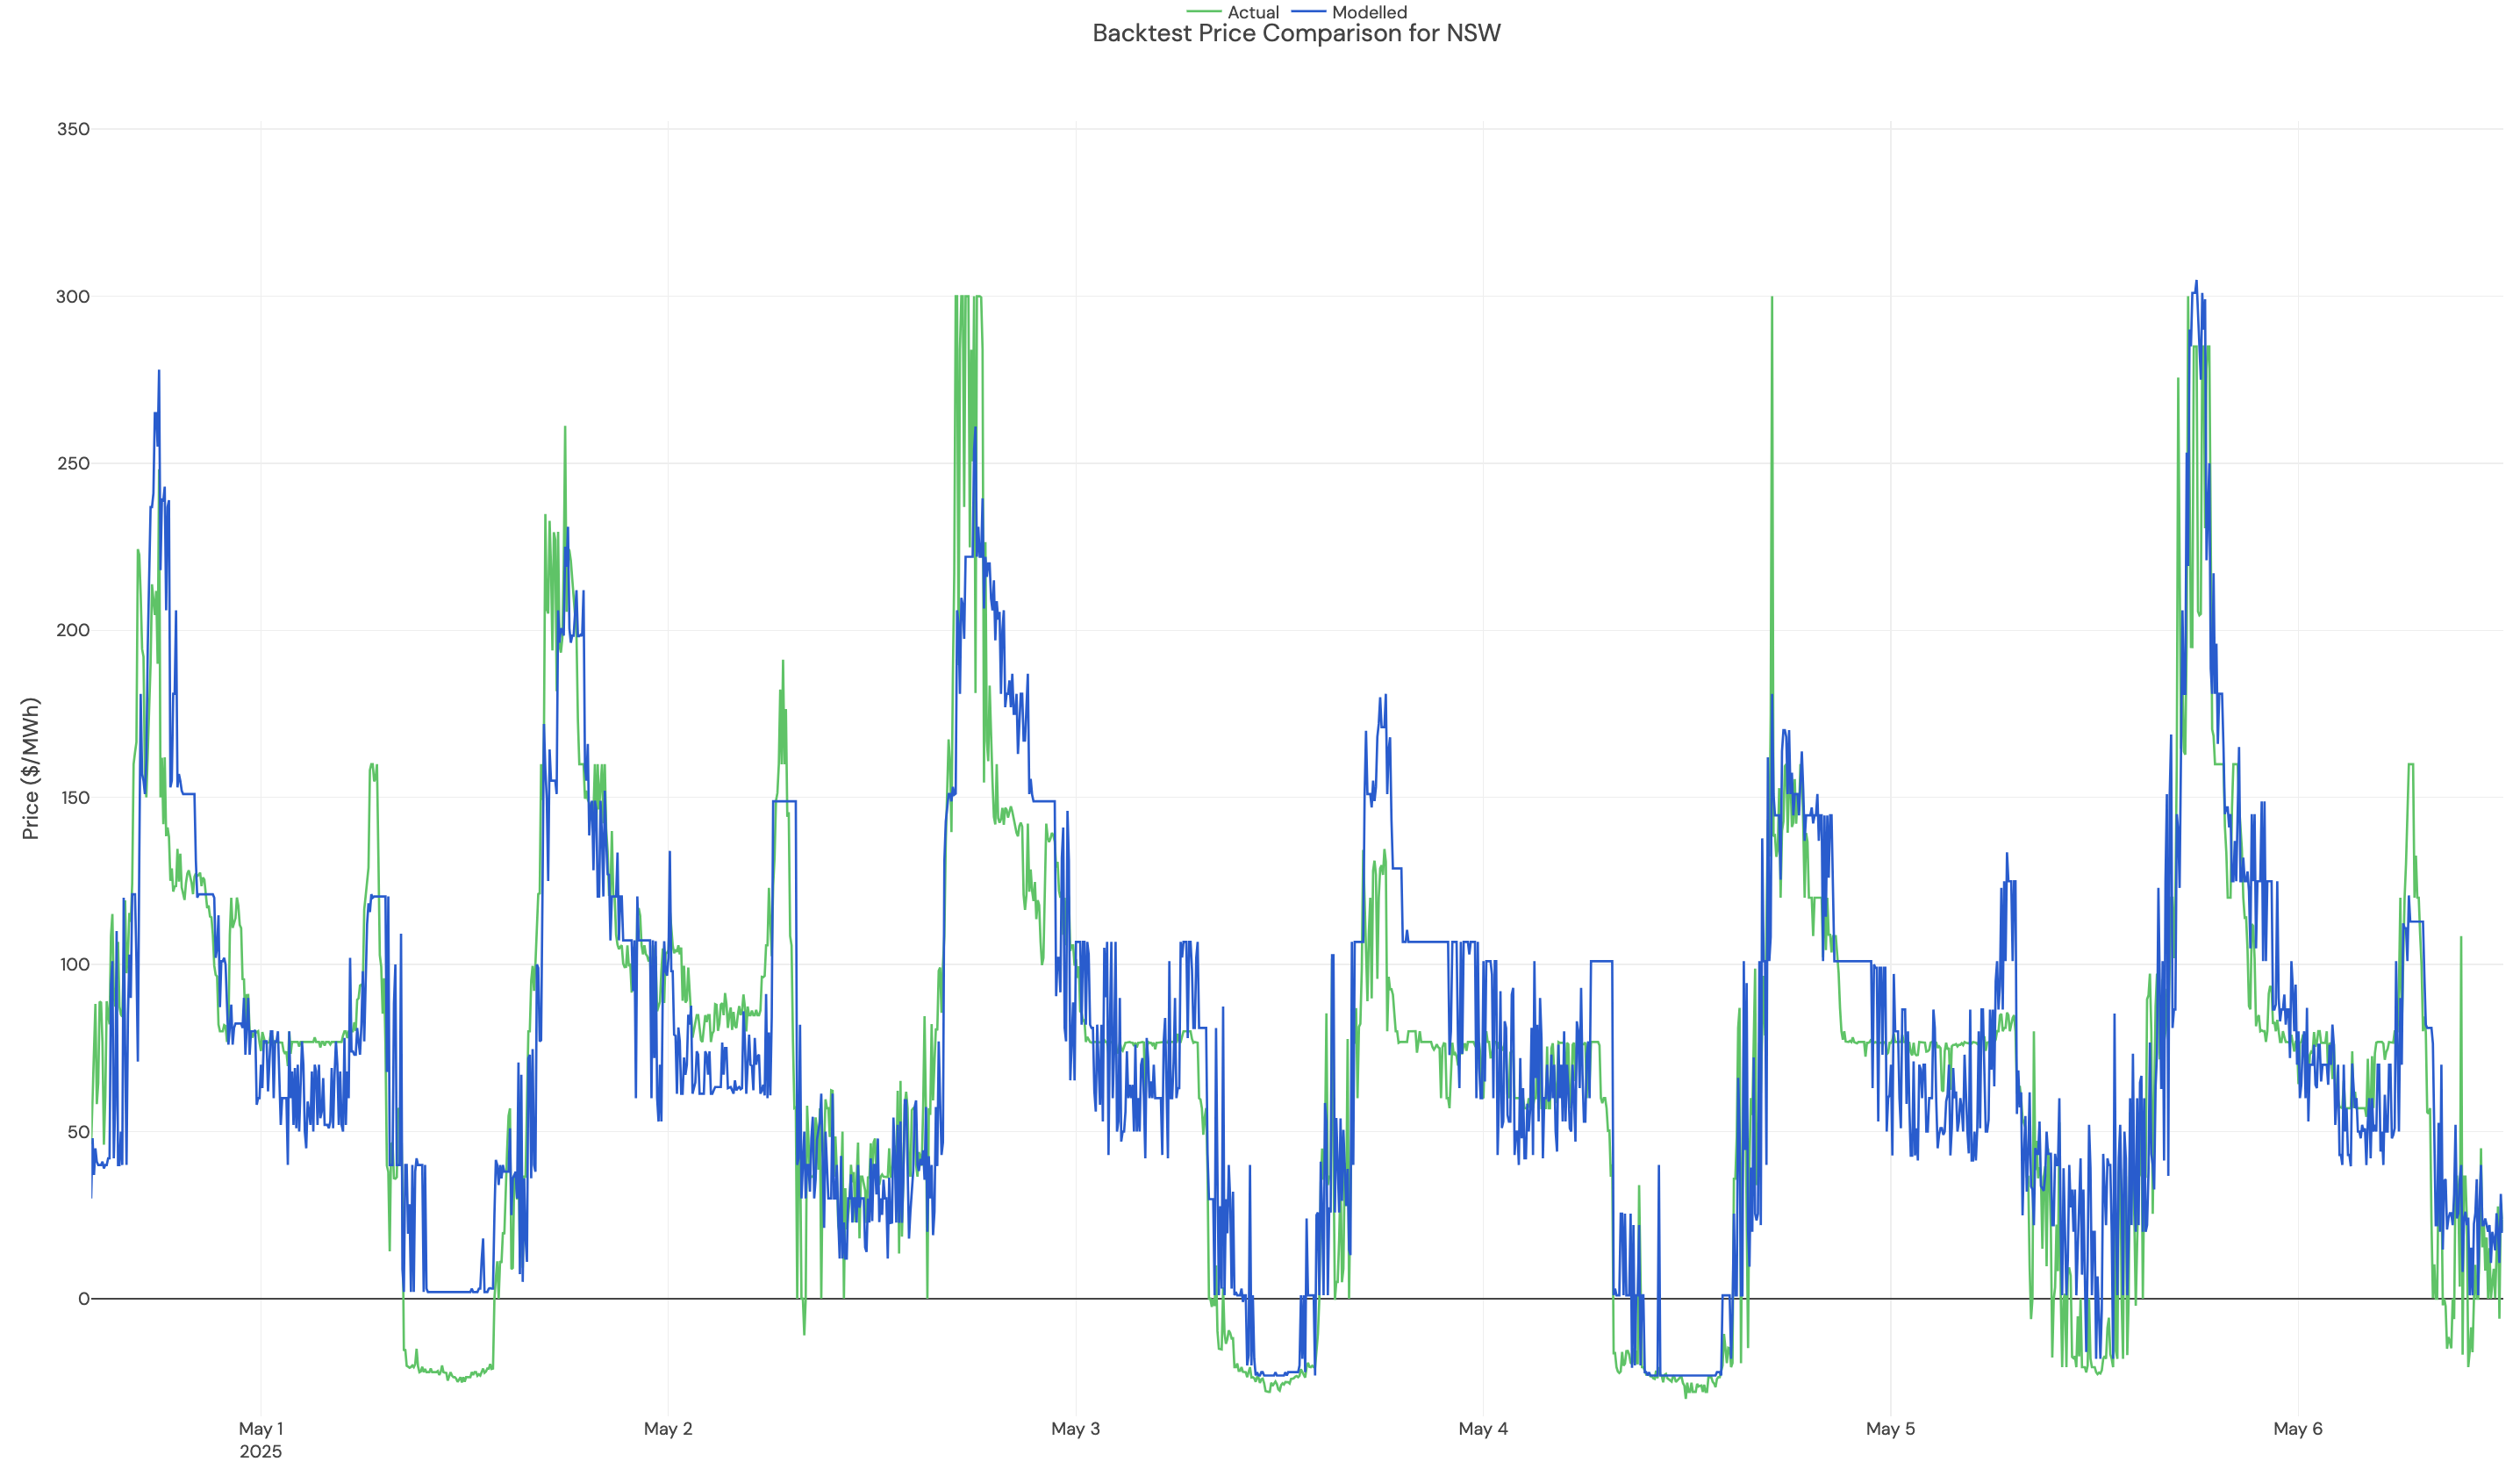
We also analysed raw prices by zooming into specific days, particularly volatile days, to find any potential dynamics that we weren't capturing fully within our model. By doing this repeatedly we have been able to iteratively improve our handling of each dynamic, making our backtest better and better each time. Below you can see an example of how well we are capturing these 5-minutely prices for New South Wales in the first week of May 2025.
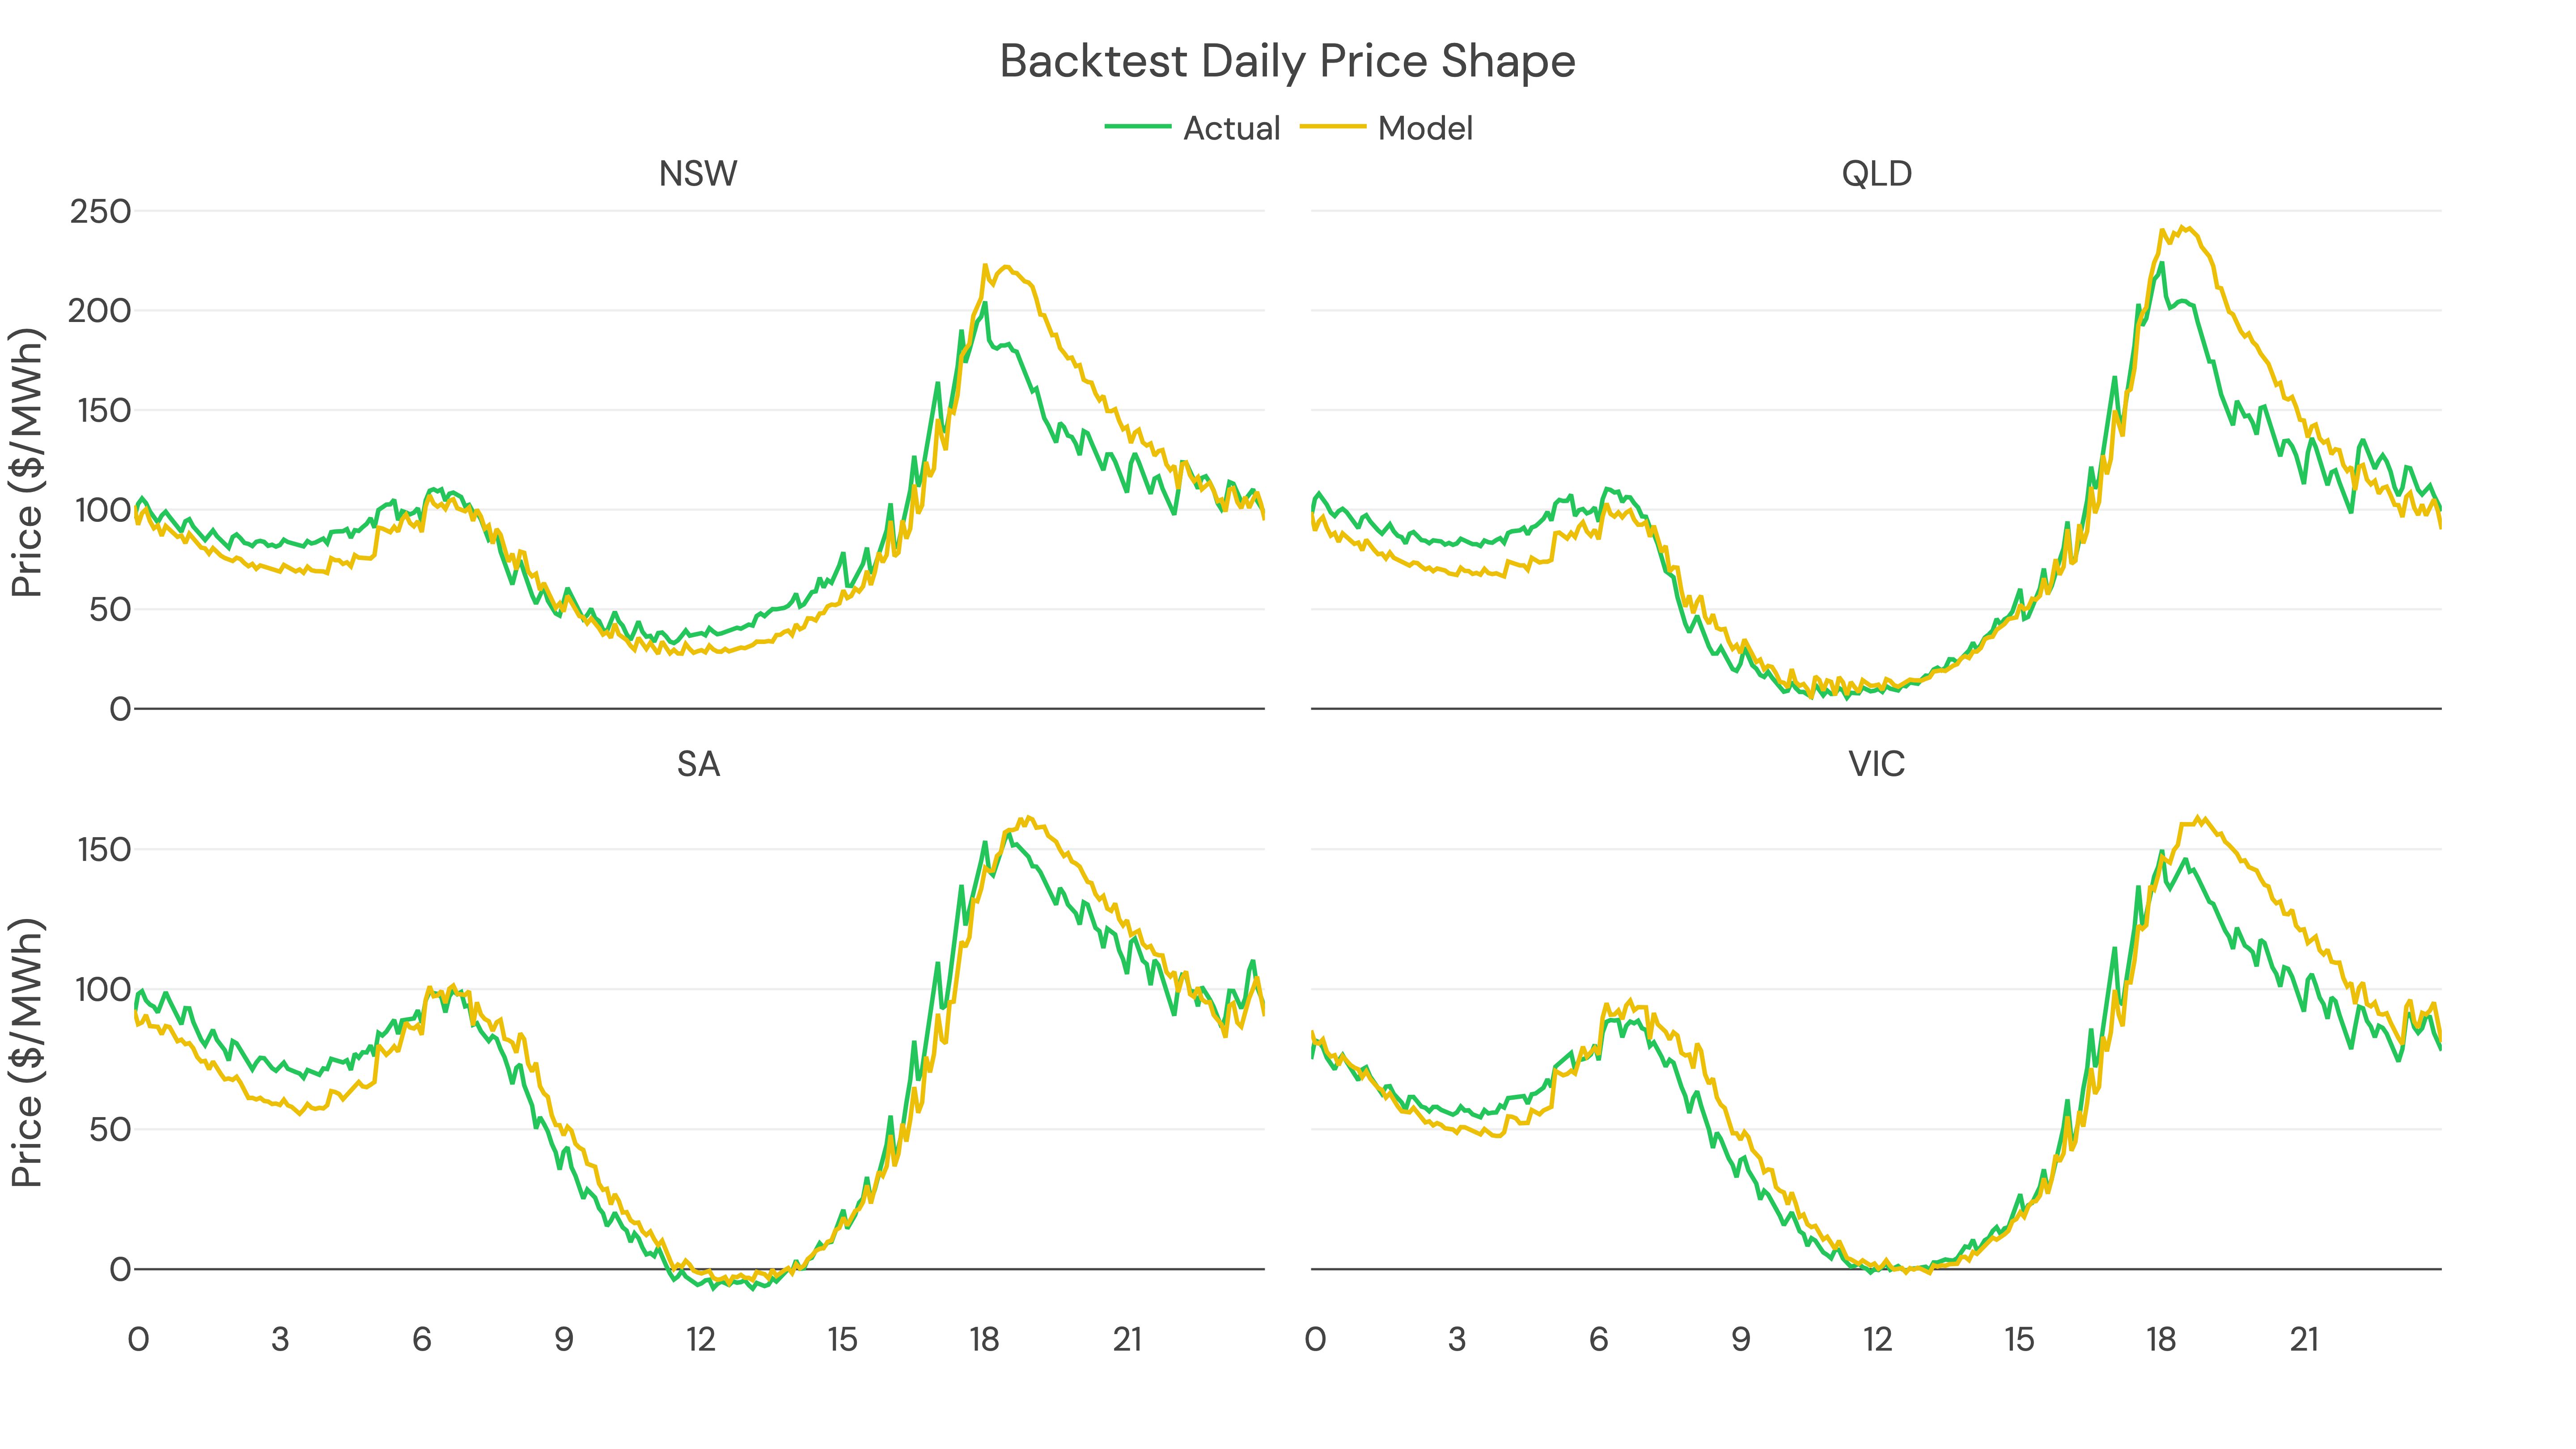
Daily Price Shape
Below is the modelled daily price shape for NSW for 2023 and 2024 compared to the actual daily price shape.
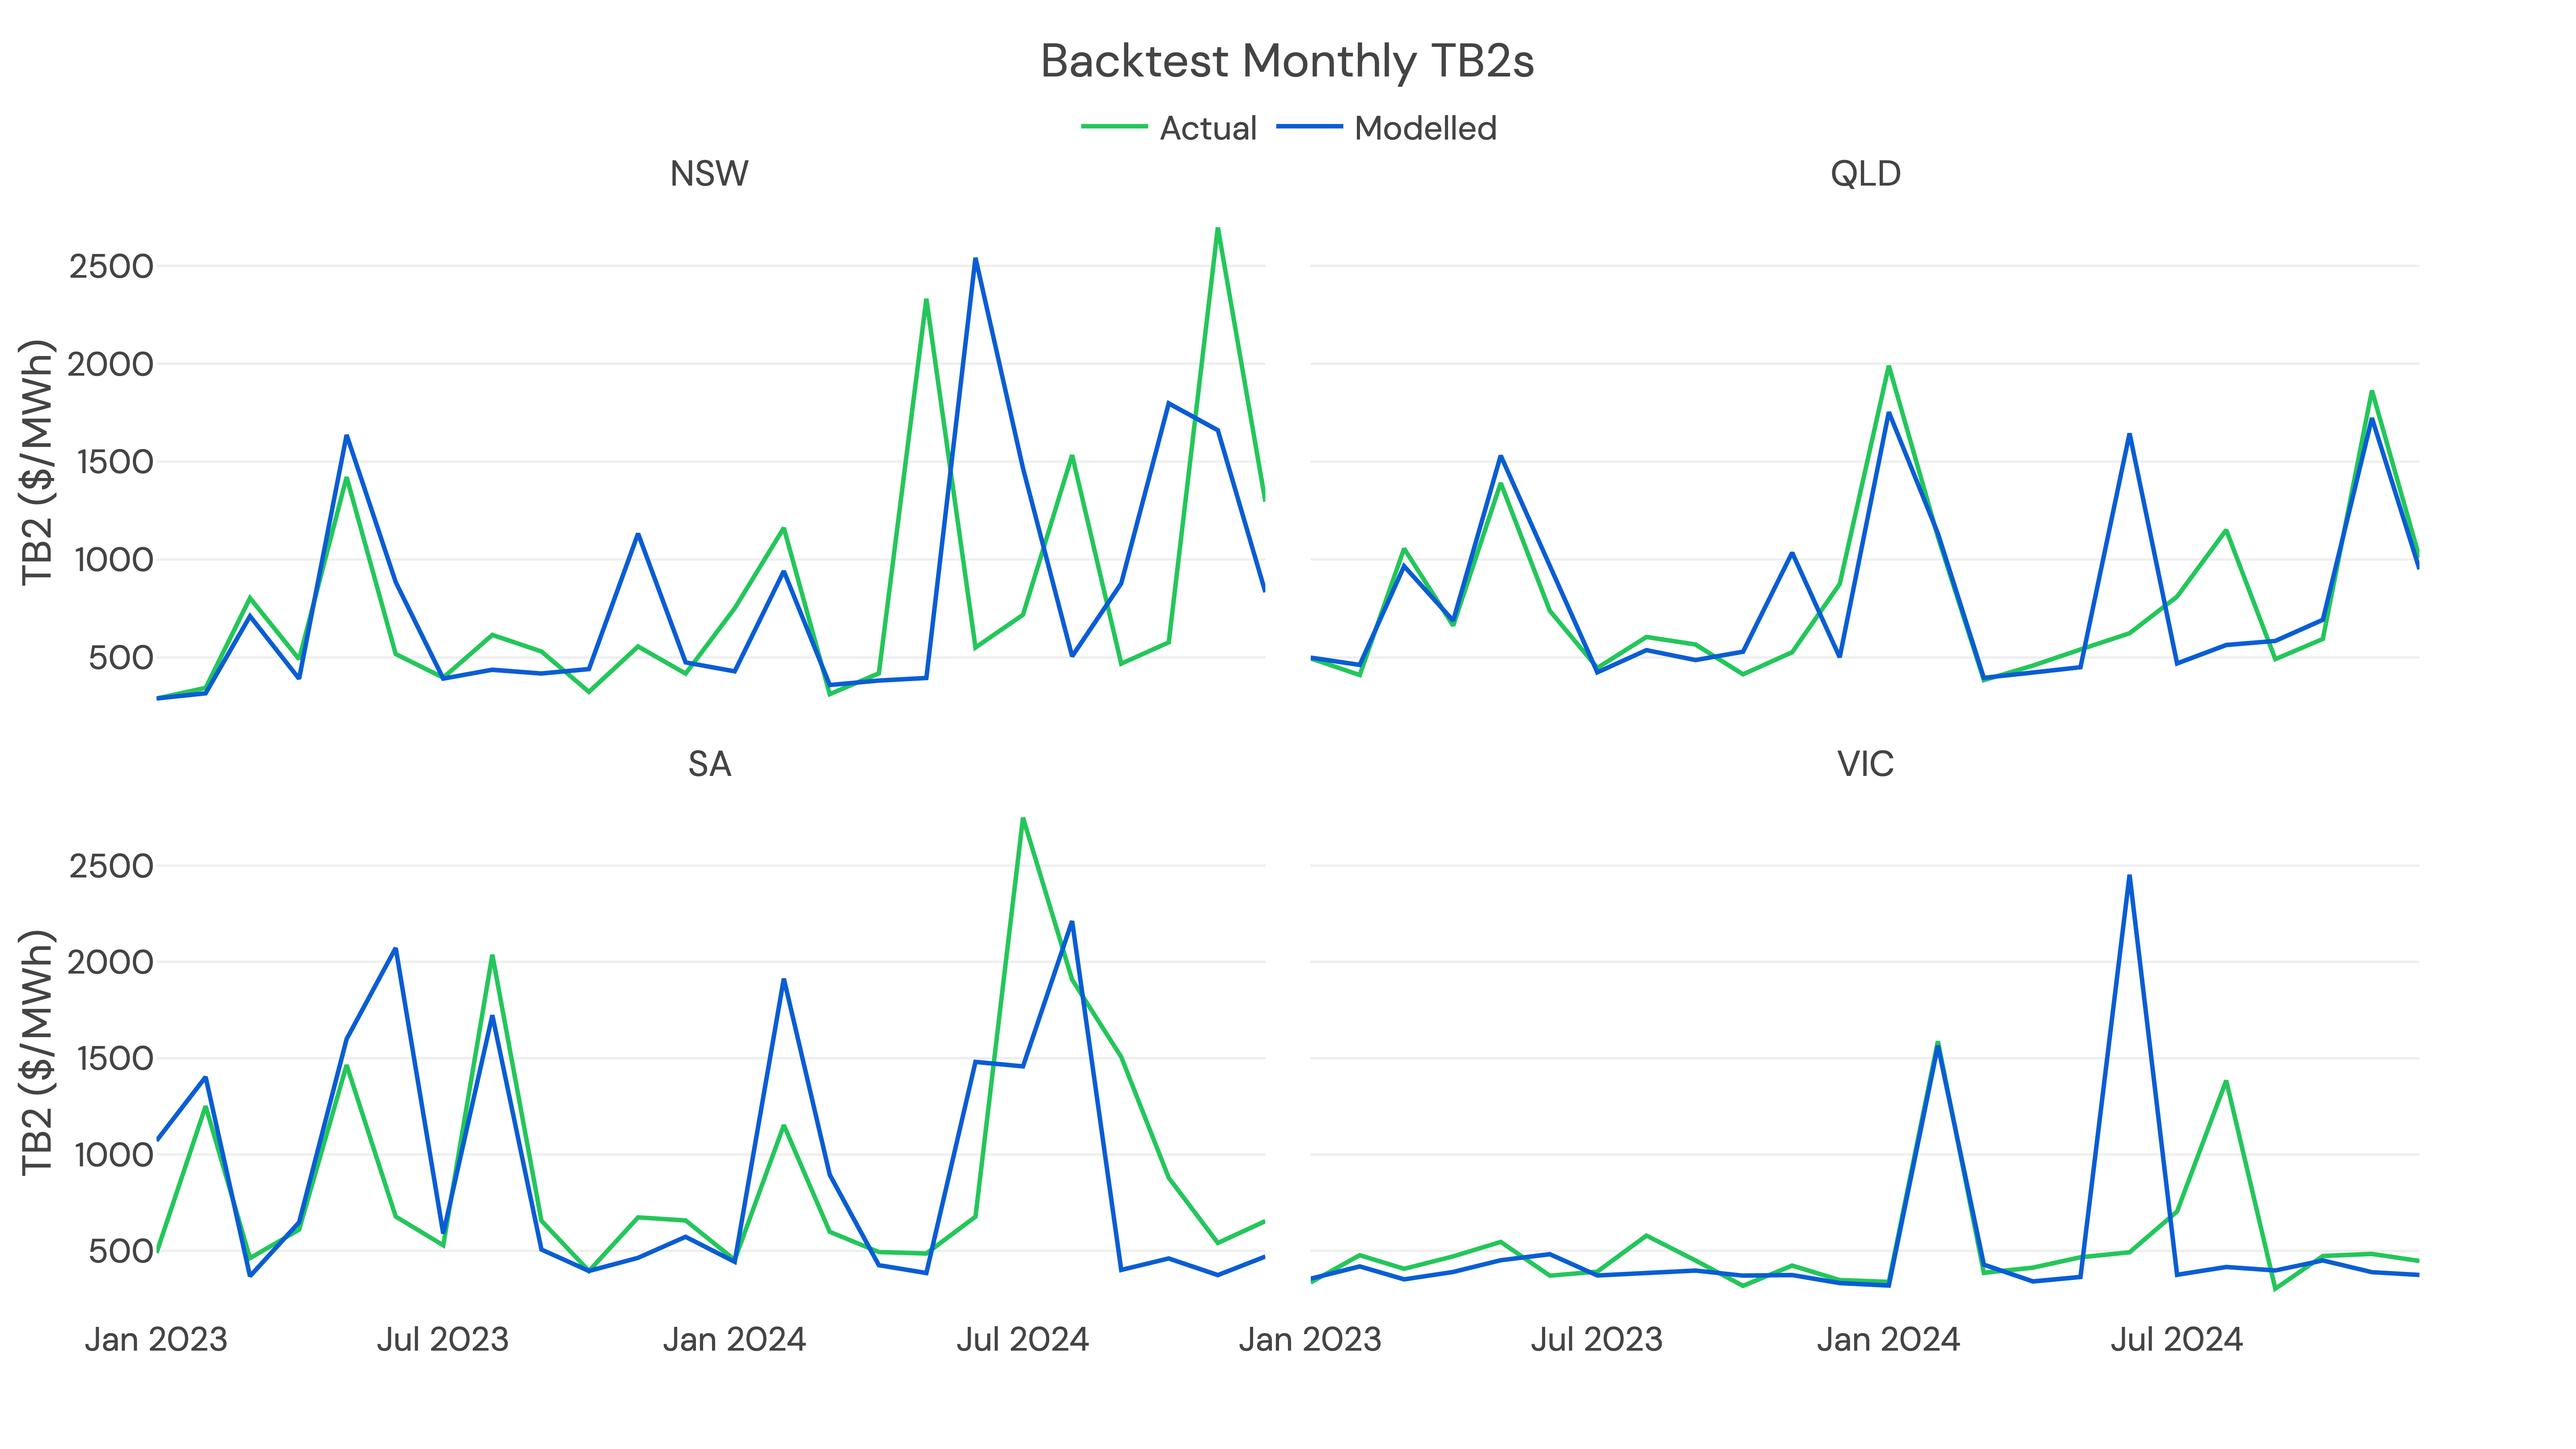
Spreads
We measure price spreads using top-bottom (TB) spreads. TBs are a particularly important metric for our forecast as they are a way of representing the battery arbitrage opportunity, quantifying the spread between the highest and lowest power prices in a given day. This is the spread that batteries can capture, by buying power when prices are low and selling it when prices are high. Read more about TBs here.
For example:
- A TB1 spread is the highest hourly price minus the lowest.
- A TB4 spread is the sum of the four highest hourly prices minus the four lowest.
- A TBX spread is the sum of the X highest hourly prices minus the X lowest.
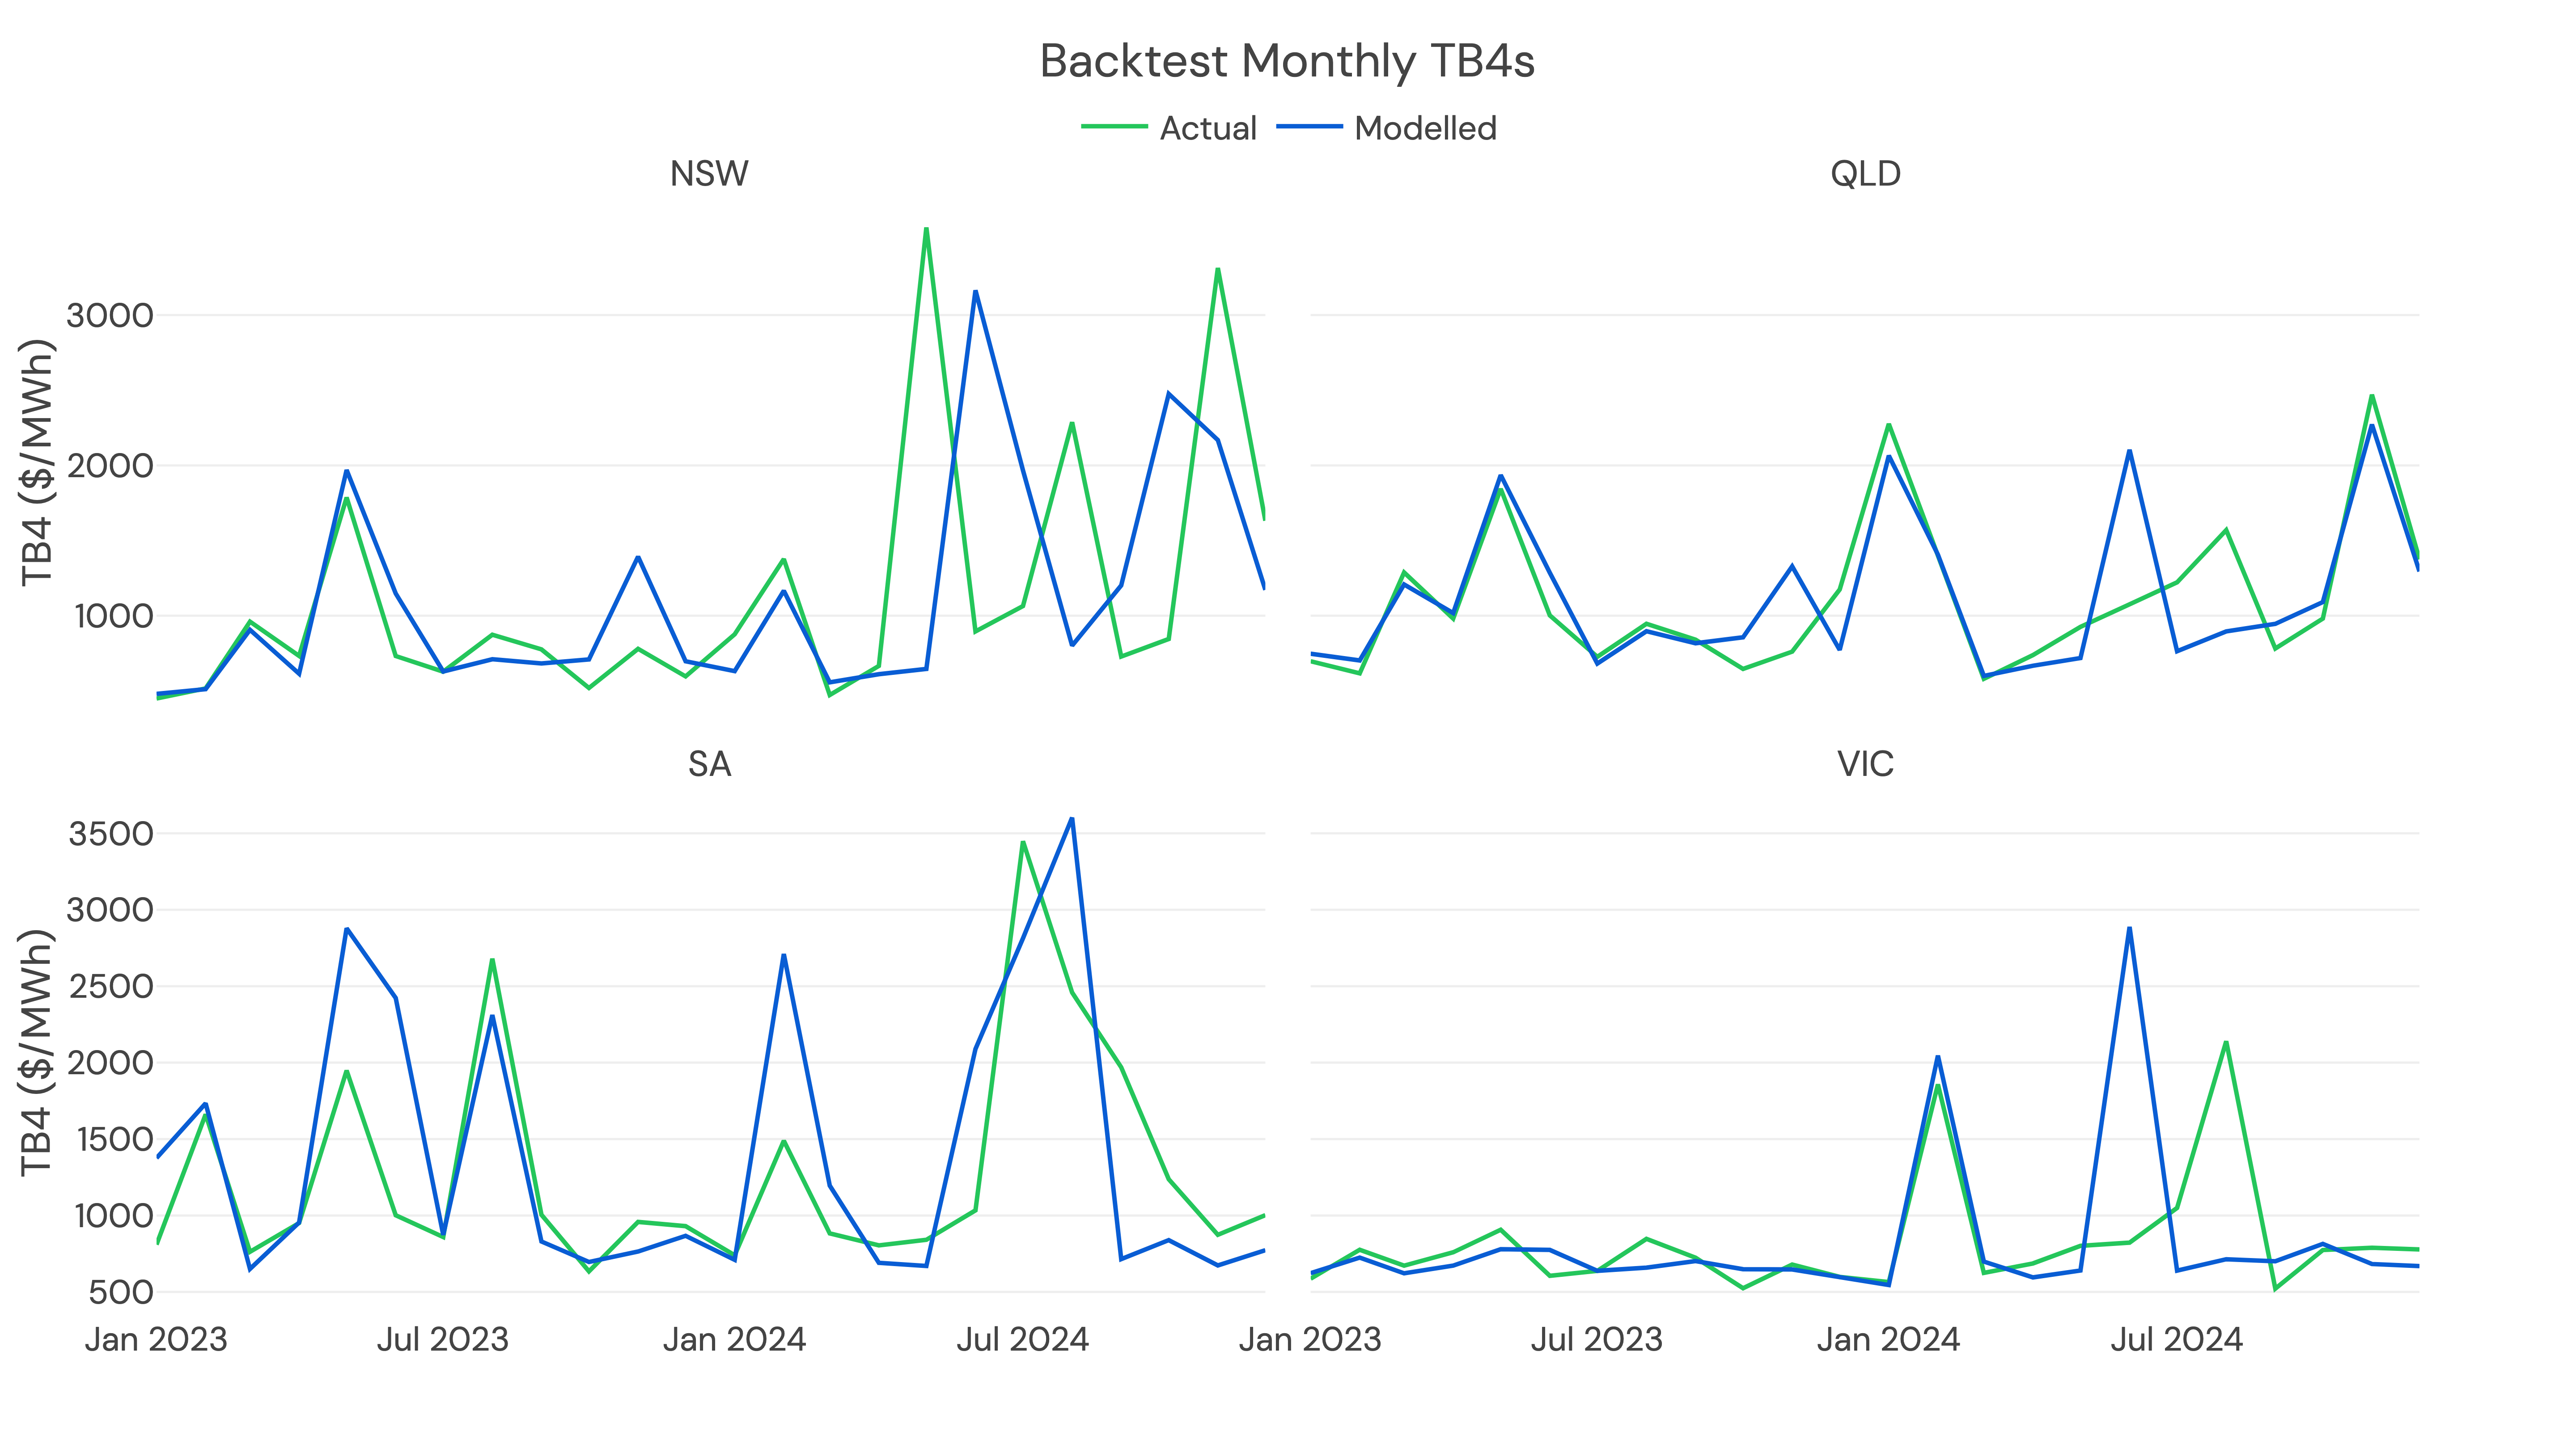
Below are our TB2s and TB4s for 2023 and 2024.
TB2
TB4
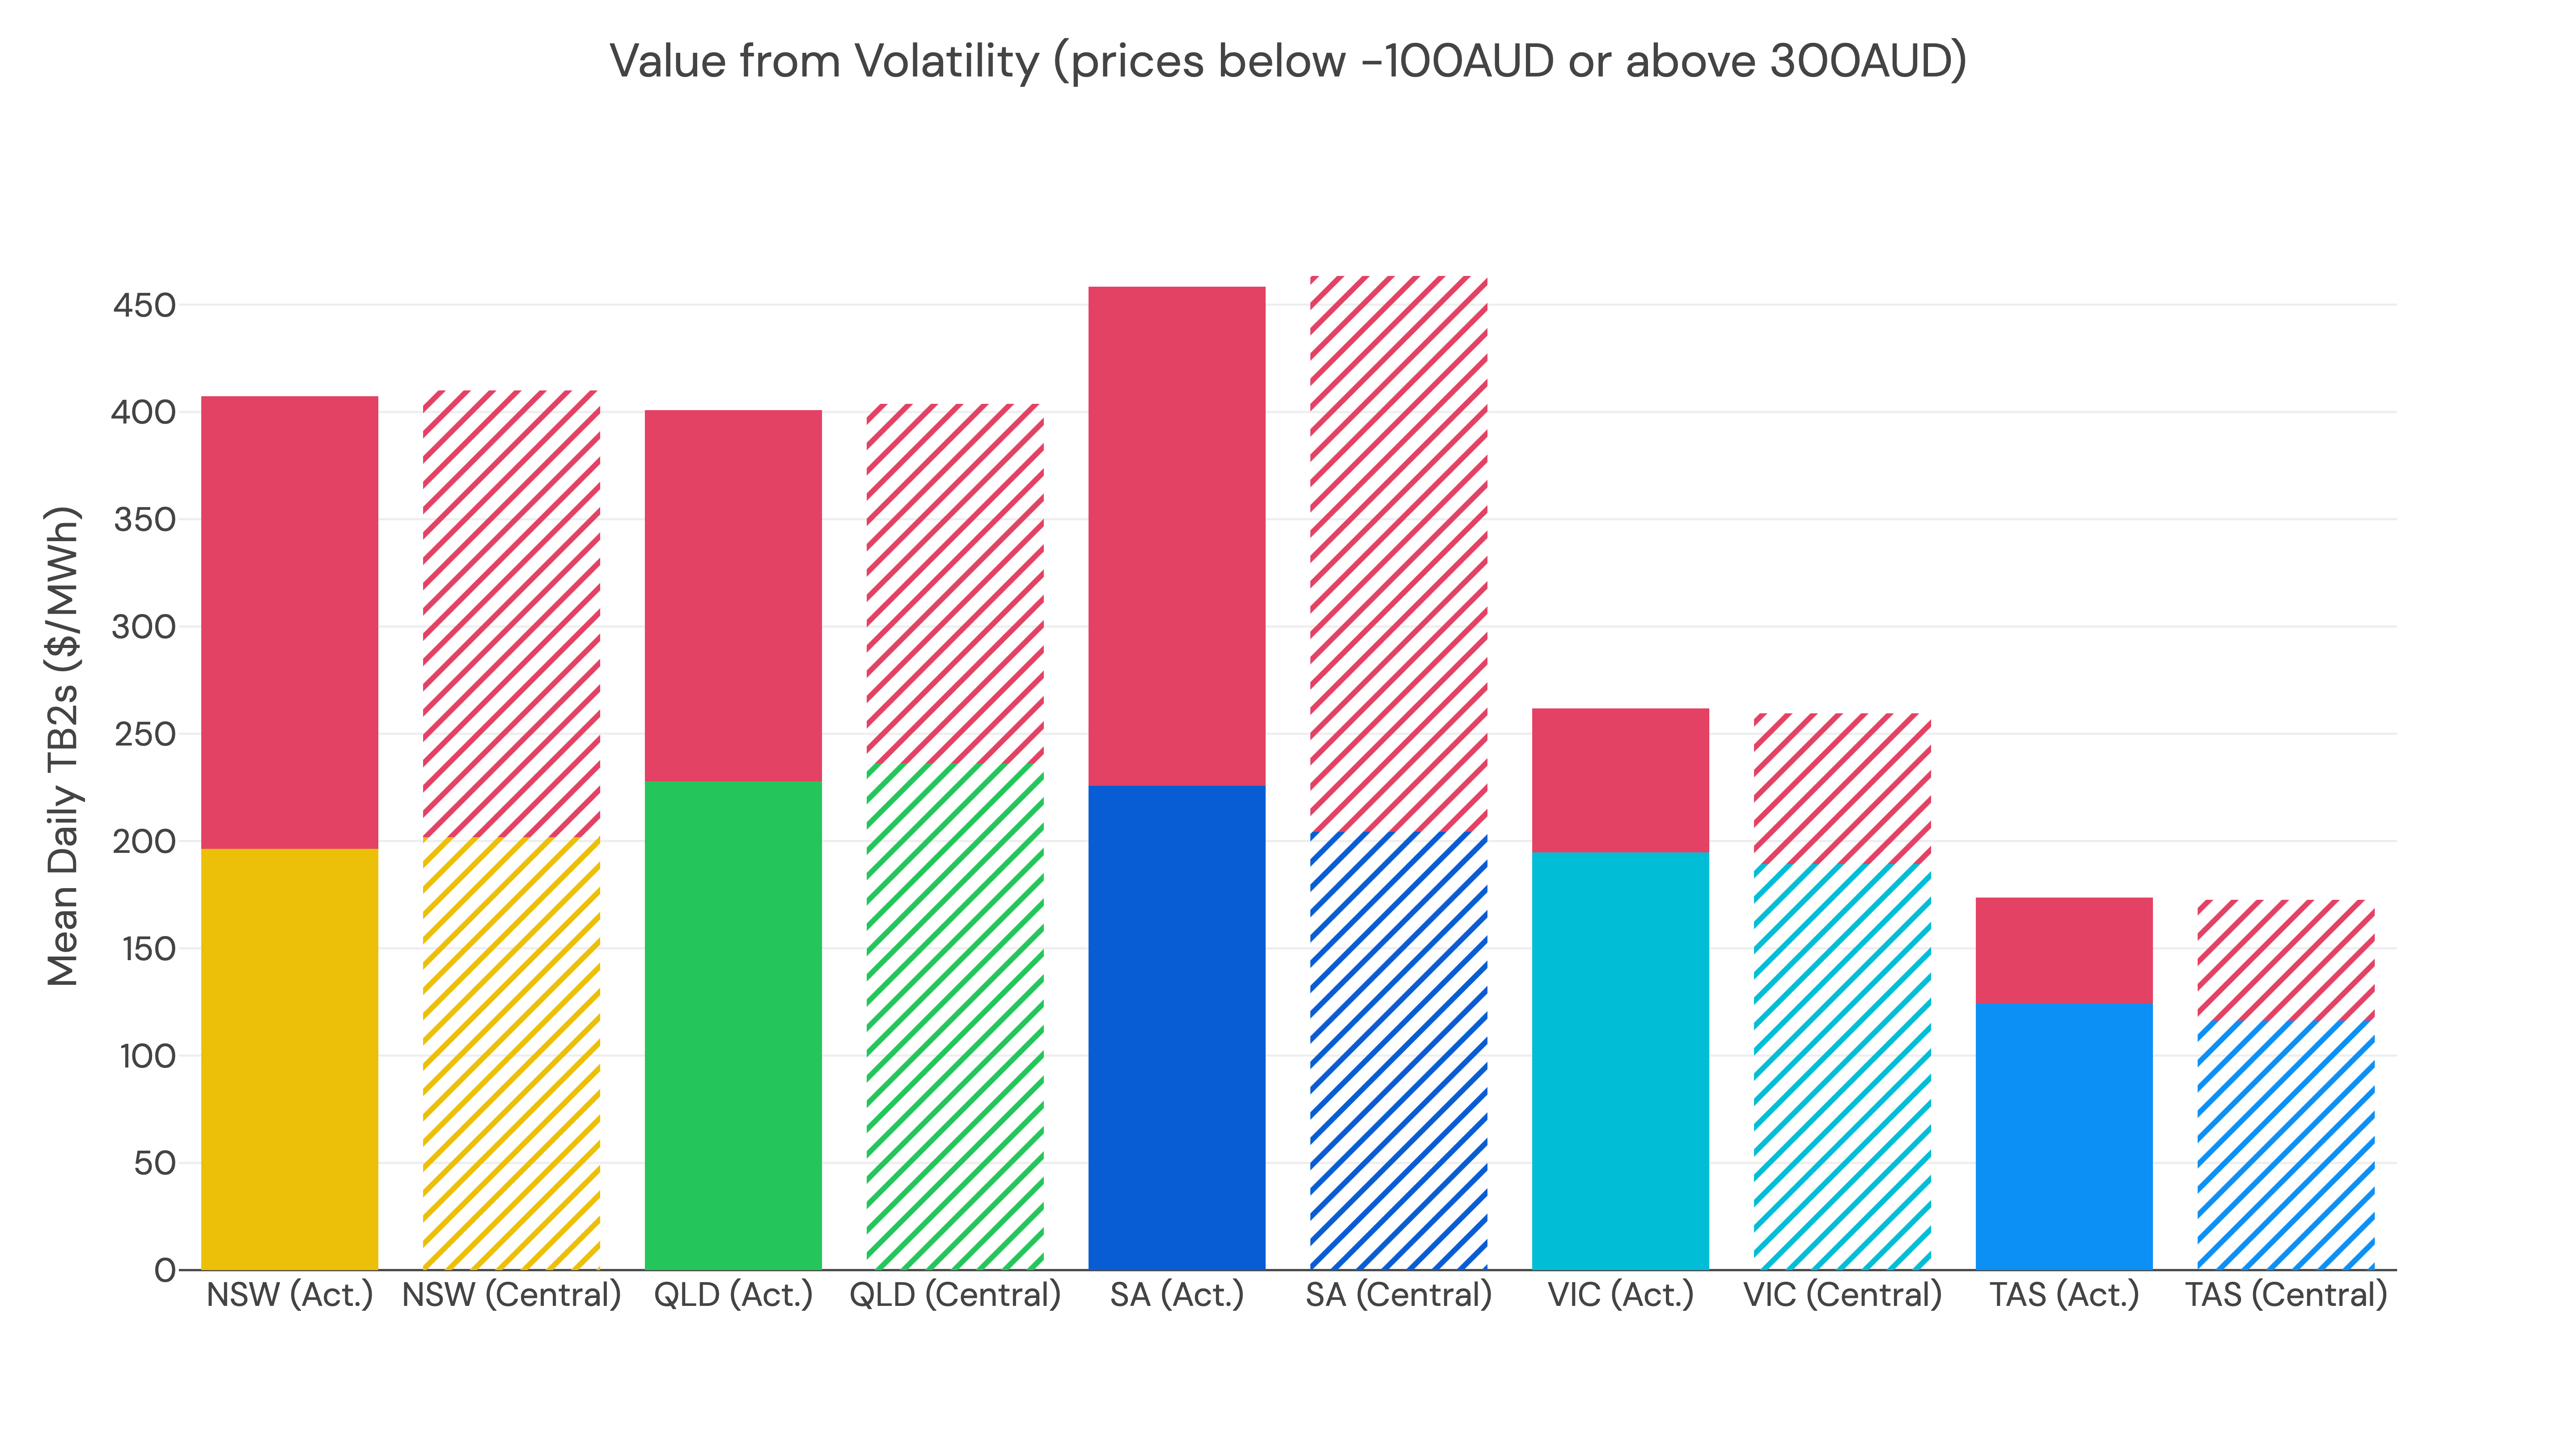
Value of Volatility
Another measure we use to assess model performance is value of volatility. This is defined as the the difference between mean TB2s calculated with volatile events, and without volatile events. Volatile prices here are defined as prices below -$100/MWh or above $300/MWh. This metric highlights the potential battery arbitrage value to be gained from volatile events.
In the chart below, the total height of the bar represents mean daily TB2s with volatile events, and the bottom portion of the bar represents TB2s without volatile events. The value of volatility is represented by the red section of the bar for each state.
Updated 11 months ago