
Demand
How we model demand.
Our demand modelling framework for the NEM captures both established consumption patterns and the growing influence of distributed energy resources (DERs).
Data Sources and Forecasting Method
For backtesting, the model uses historical operational demand data sourced from AEMO. For forecasting, we apply demand profiles from a representative weather year (2023), scaled to align with annual consumption projections from AEMO’s Electricity Statement of Opportunities (ESOO). This approach preserves realistic temporal variability while anchoring forecasts in long-term energy trends.
Operational vs. Underlying Demand
To reflect the impact of DERs on grid behaviour, we distinguish between two key types of demand:
- Operational Demand: Electricity demand to be supplied directly by the supply stack.
- Underlying Demand: Total electricity demand, including generation from behind-the-meter resources.
This disaggregation enables the model to isolate the influence of growth of technologies such as rooftop solar and behind-the-meter storage on operational demand, and therefore forecast future demand more accurately.
Modelling Consumer Energy Resources (CER)
We also account for other consumer-side technologies that reduce operational demand, including:
- Rooftop PV
- Behind-the-Meter Battery Storage
- Electric Vehicle to Home (V2H)
Below is an example of how demand is modelled across a single day in 2045.
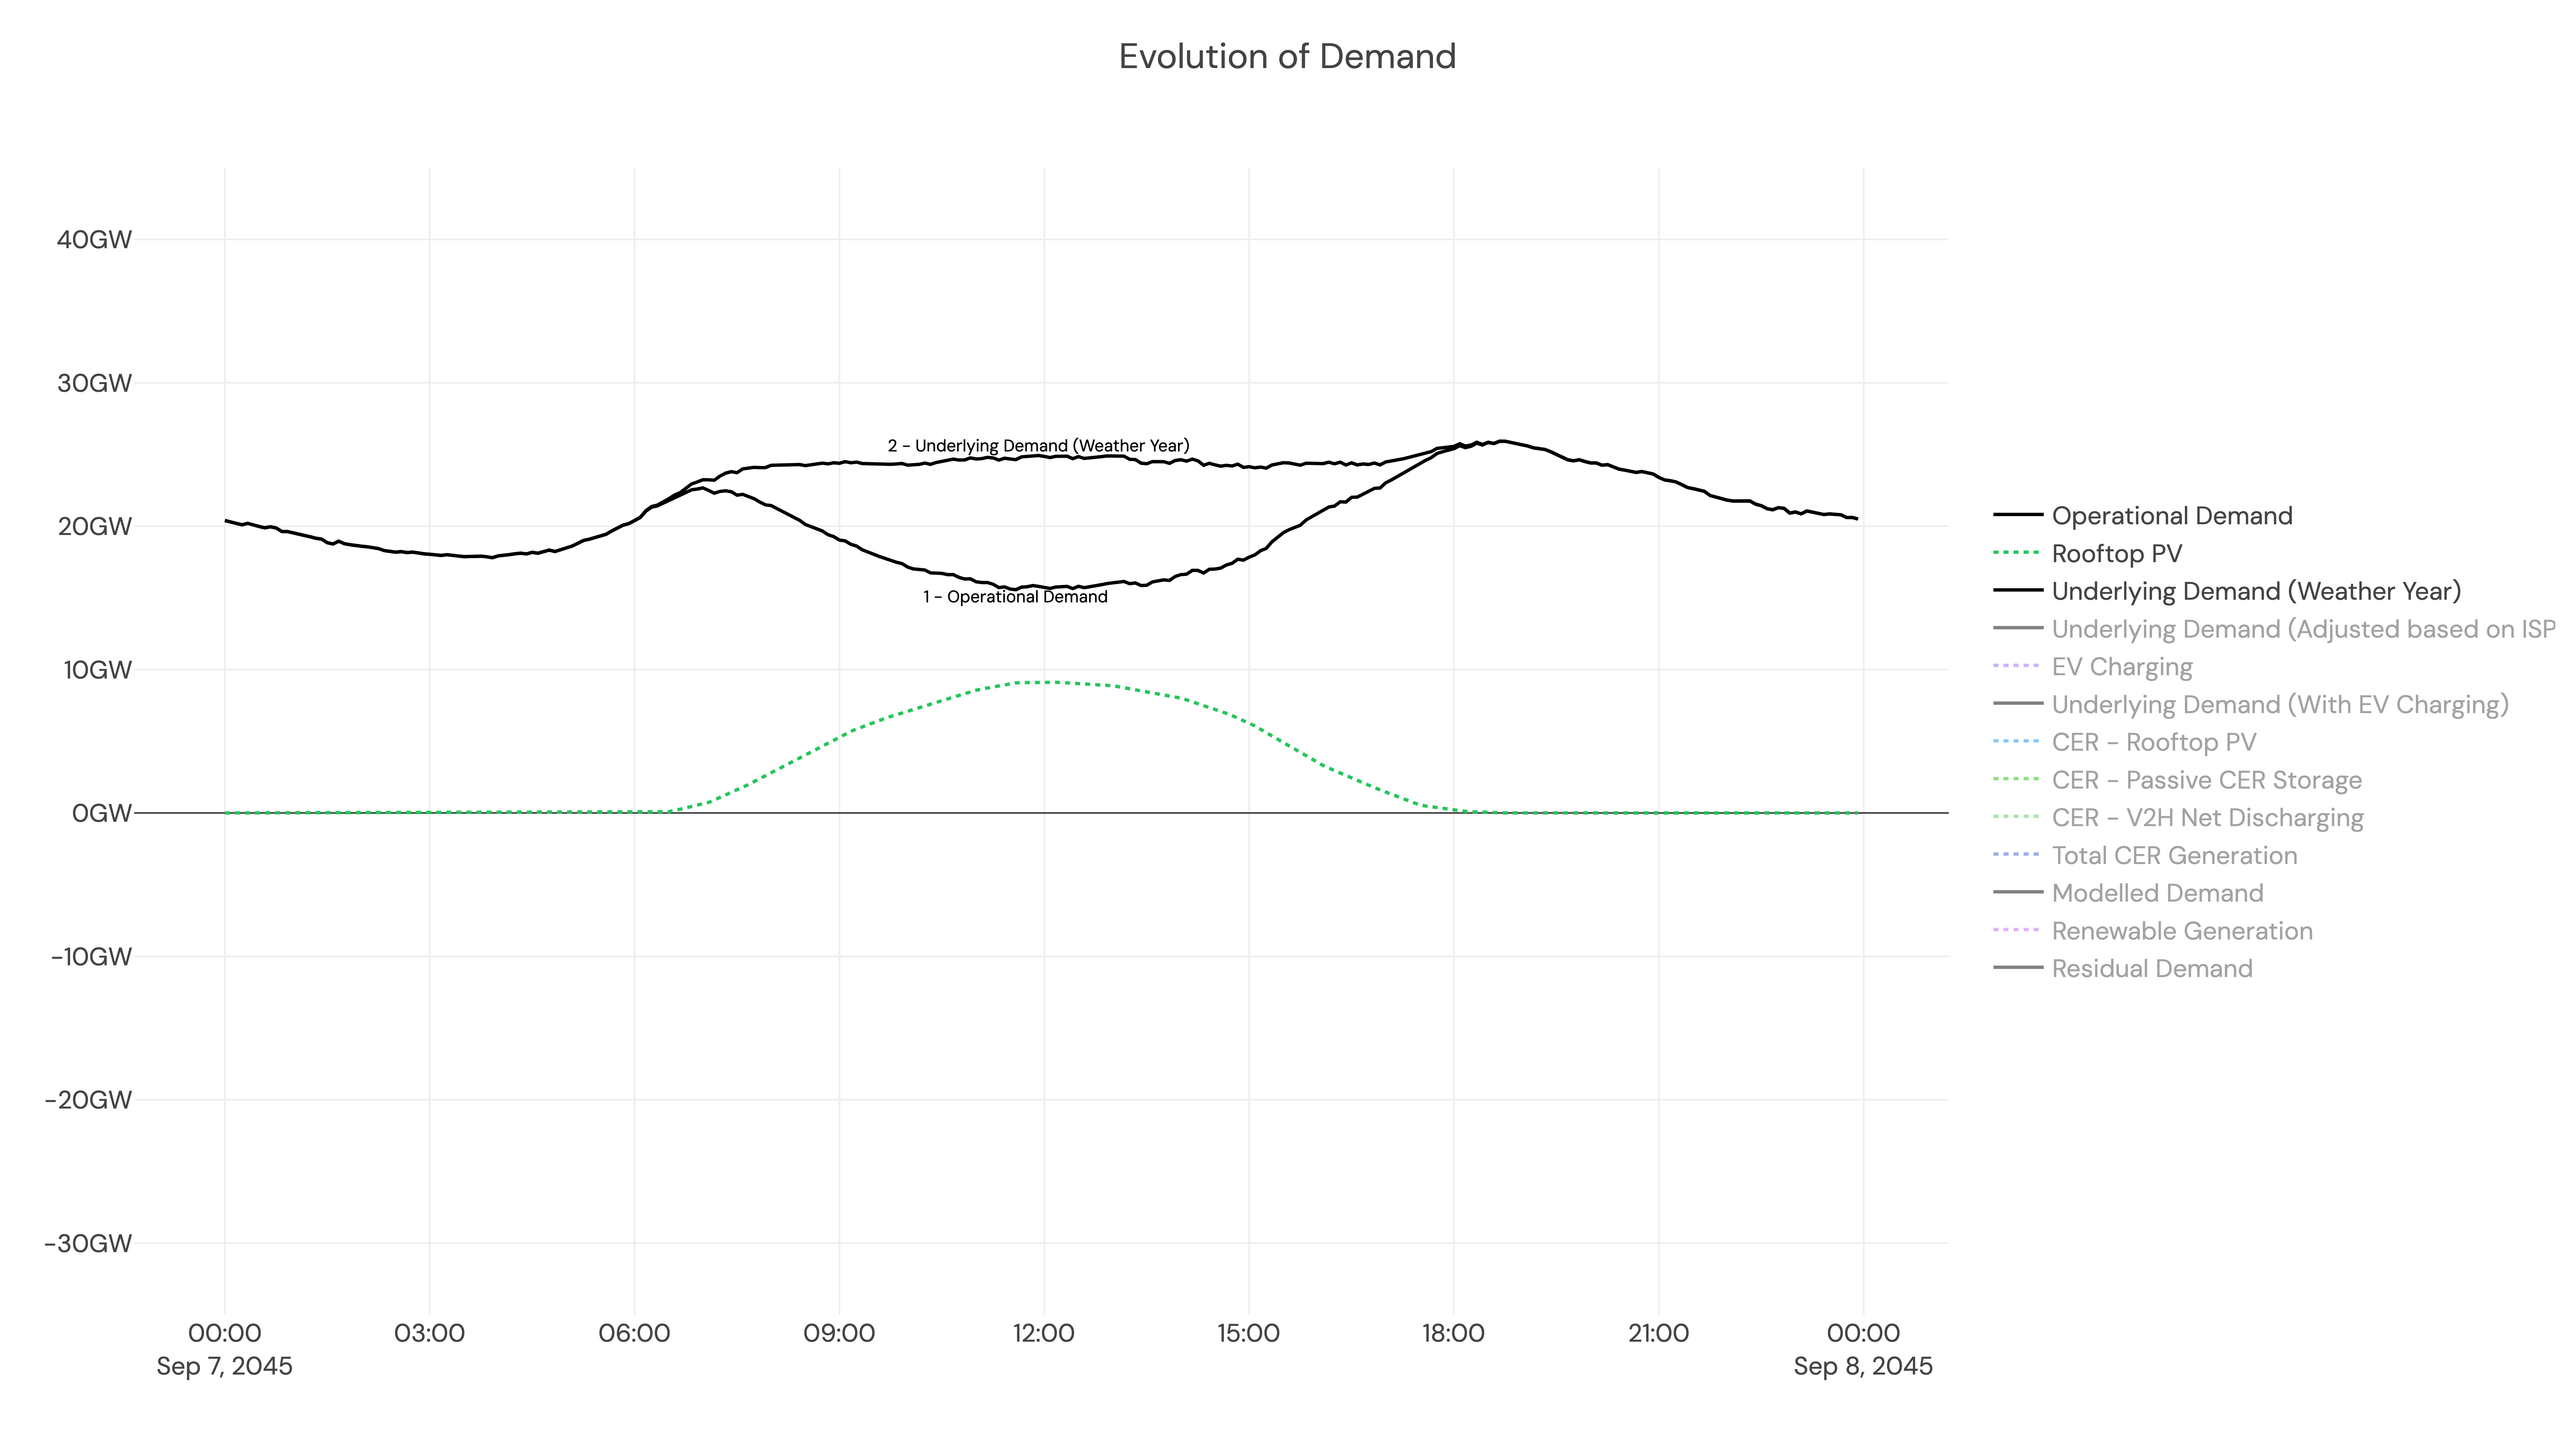
We start with calculating historical underlying demand from our weather year
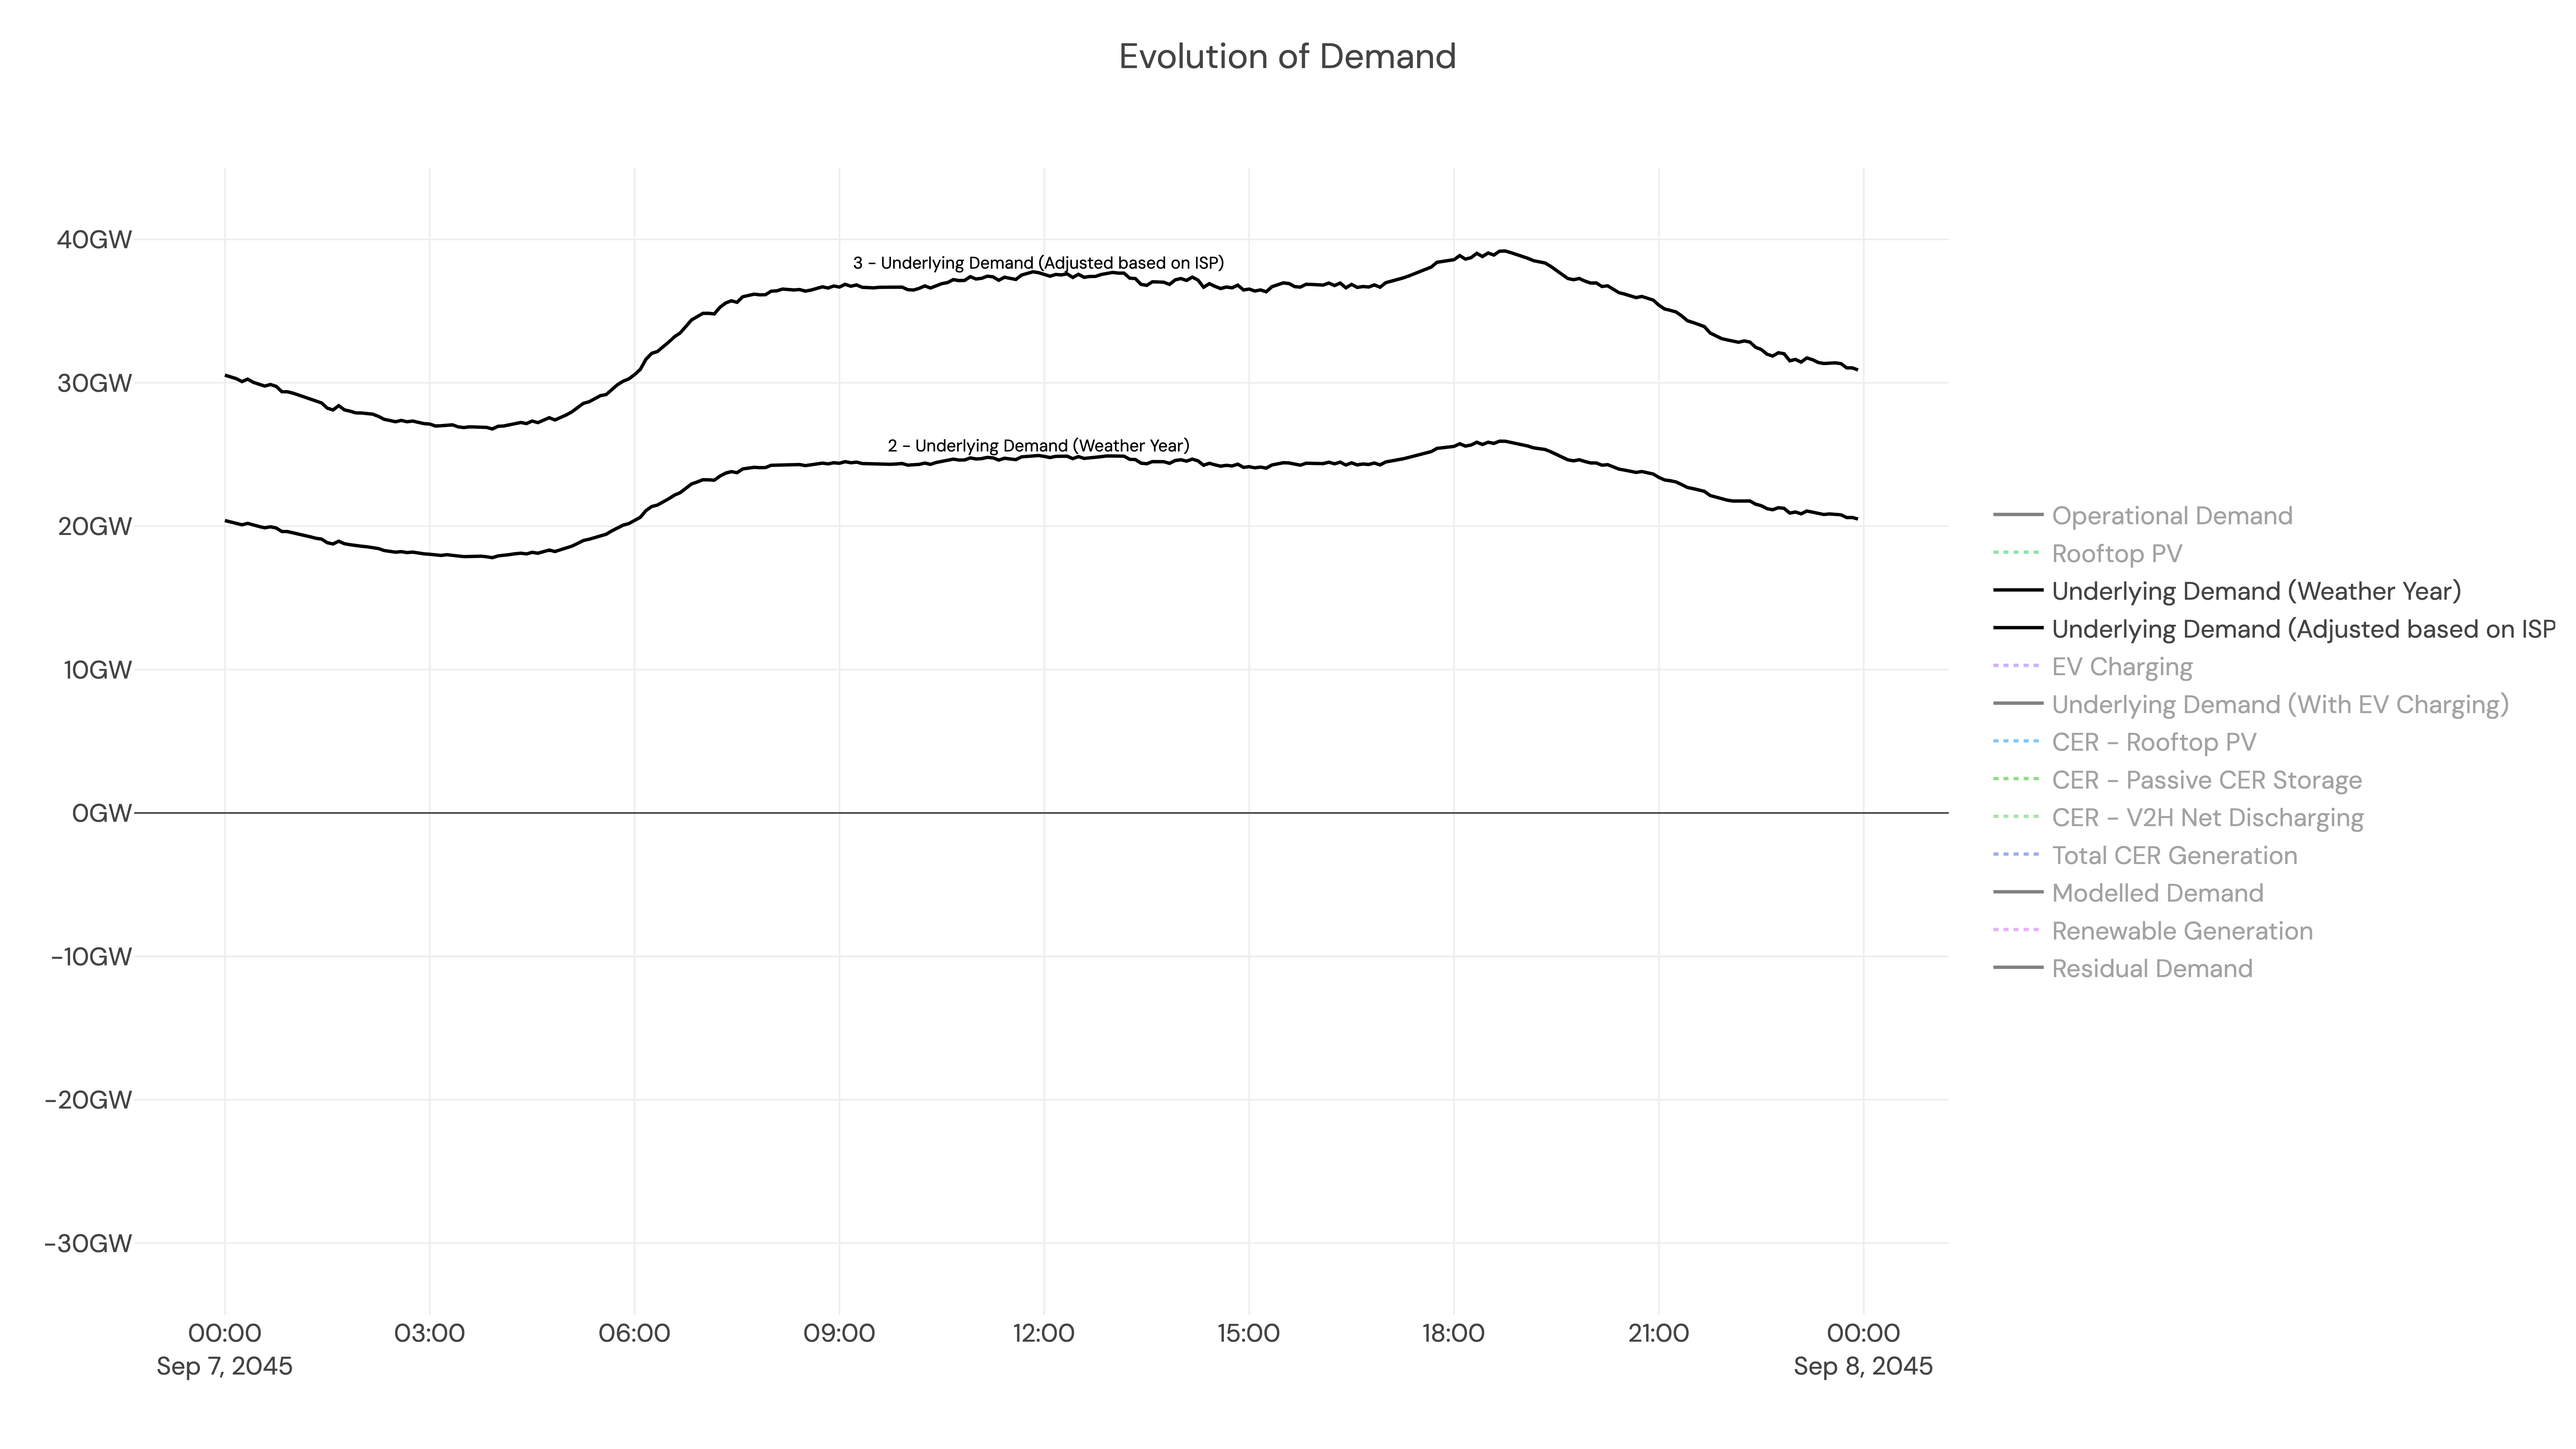
Then we scale underlying demand based on annual ISP demand figures
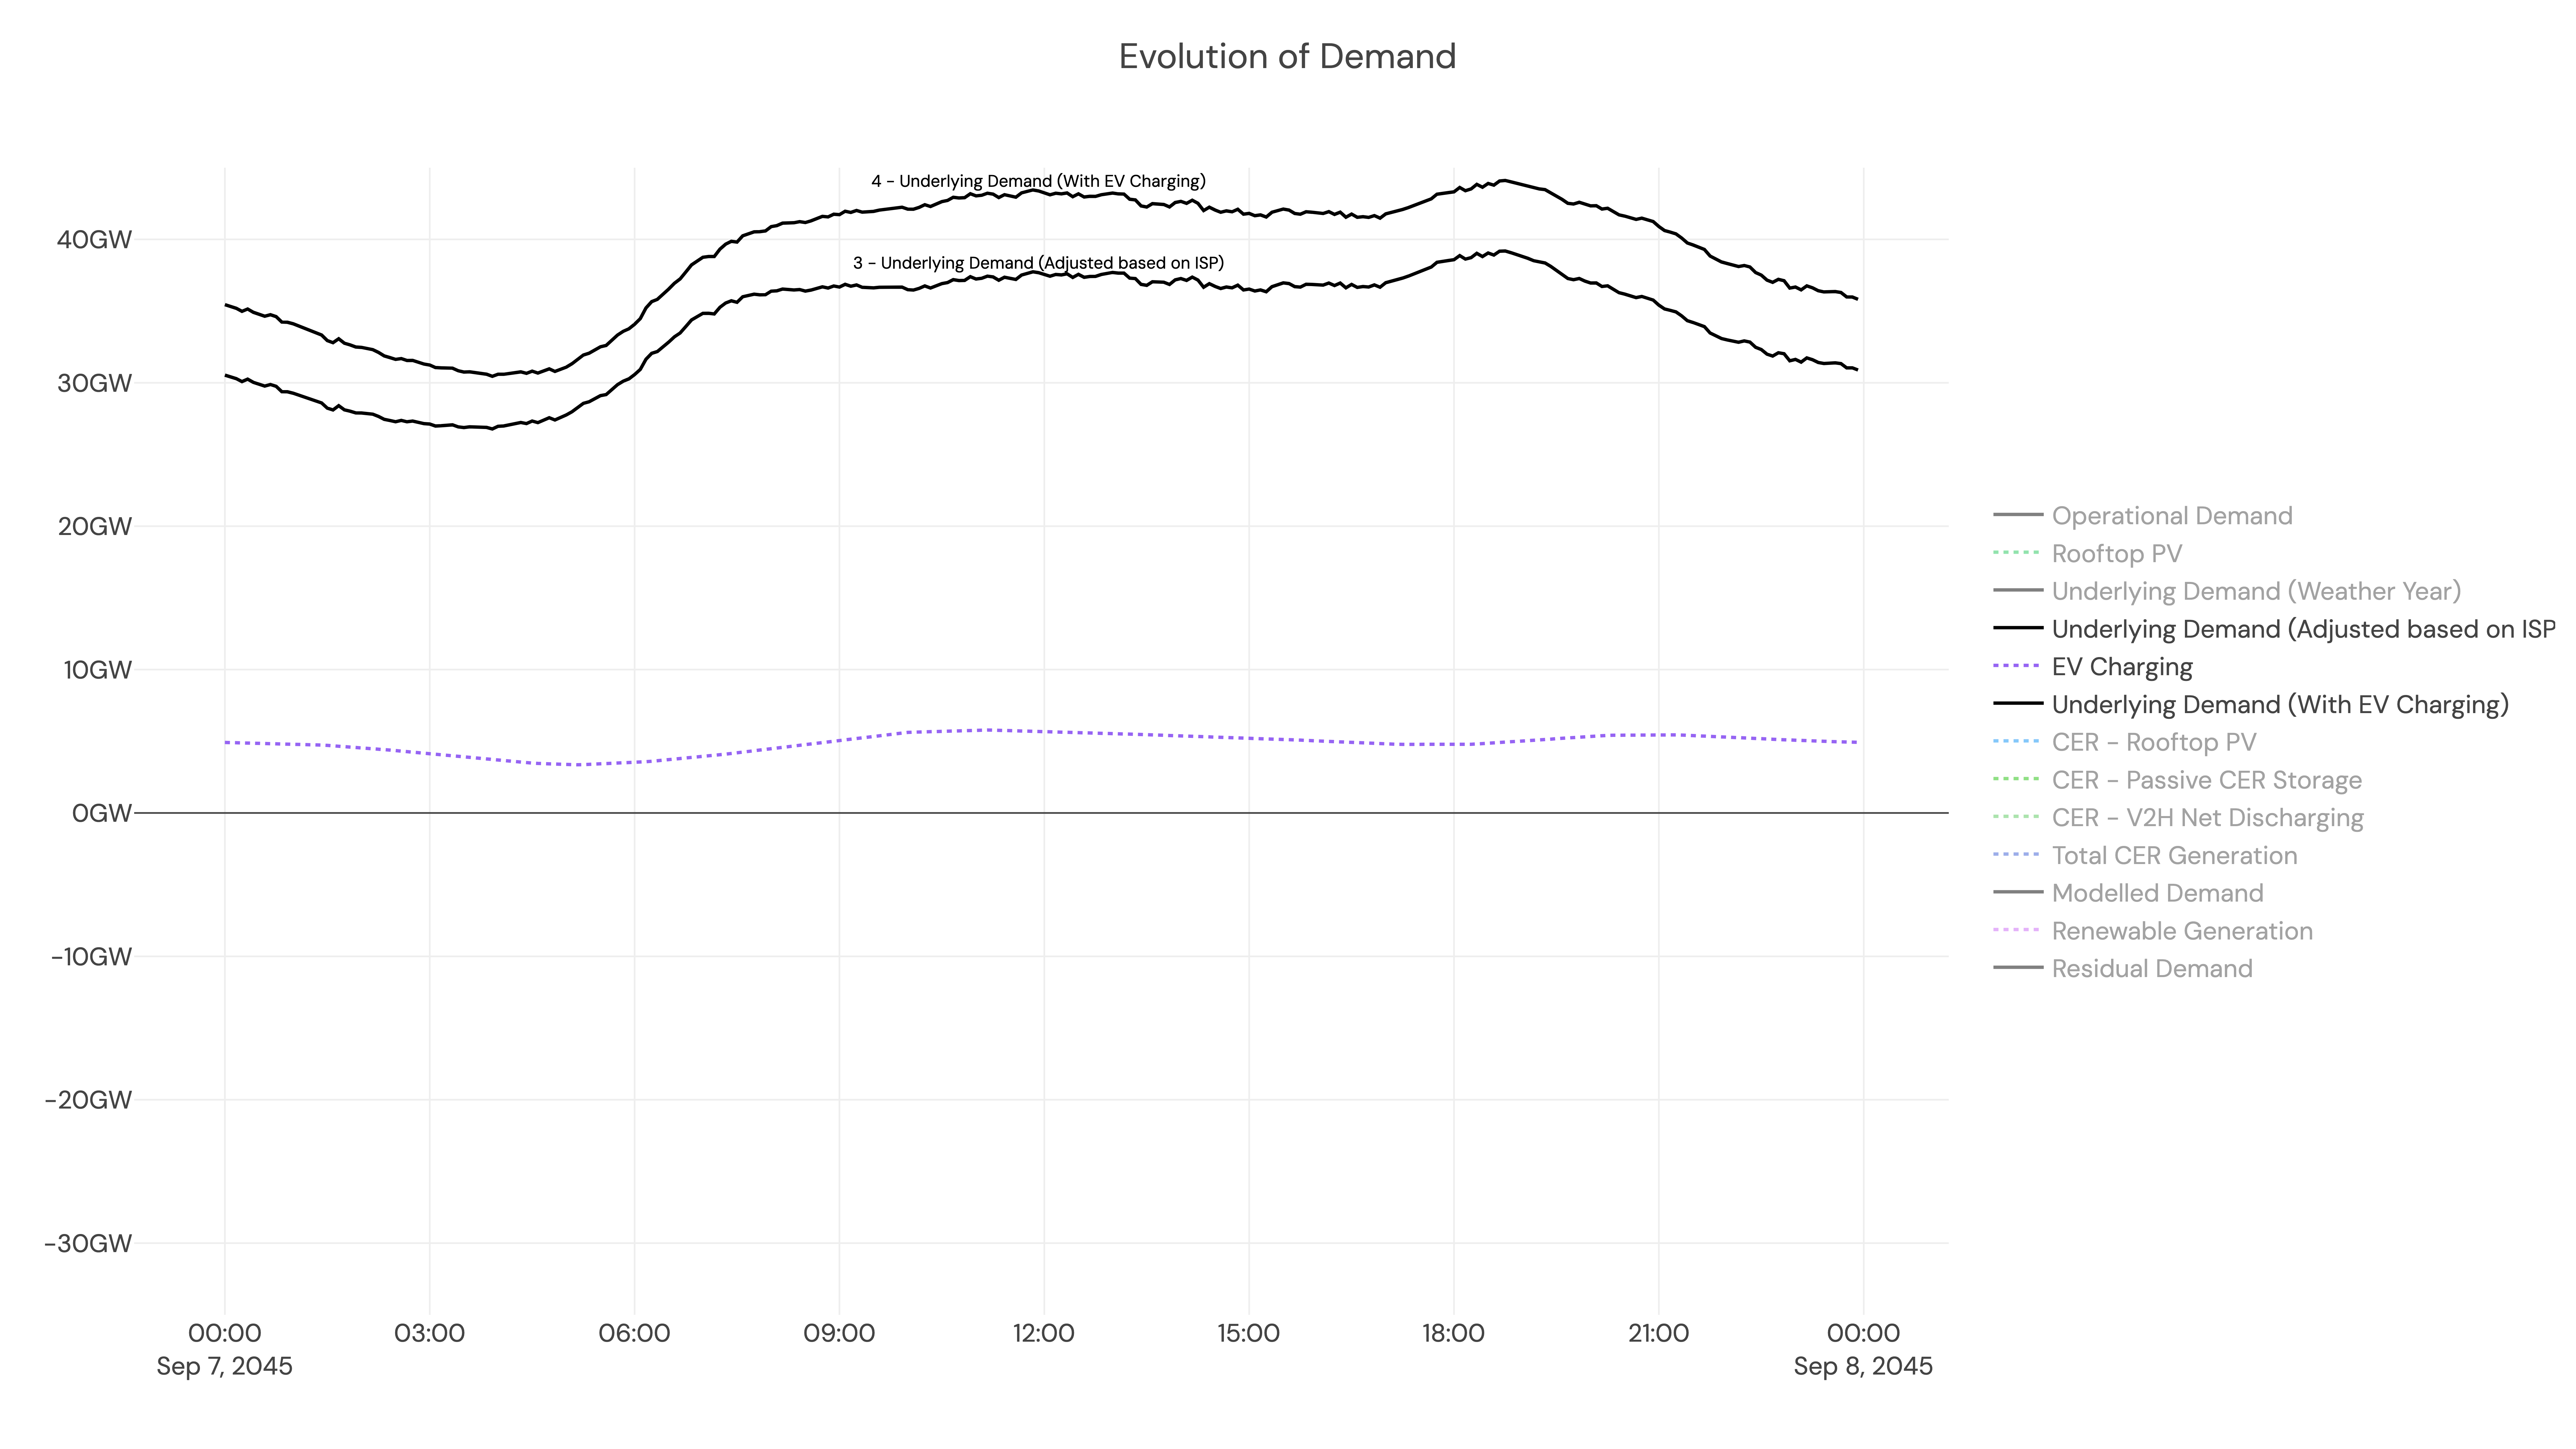
Add projected EV charging demand
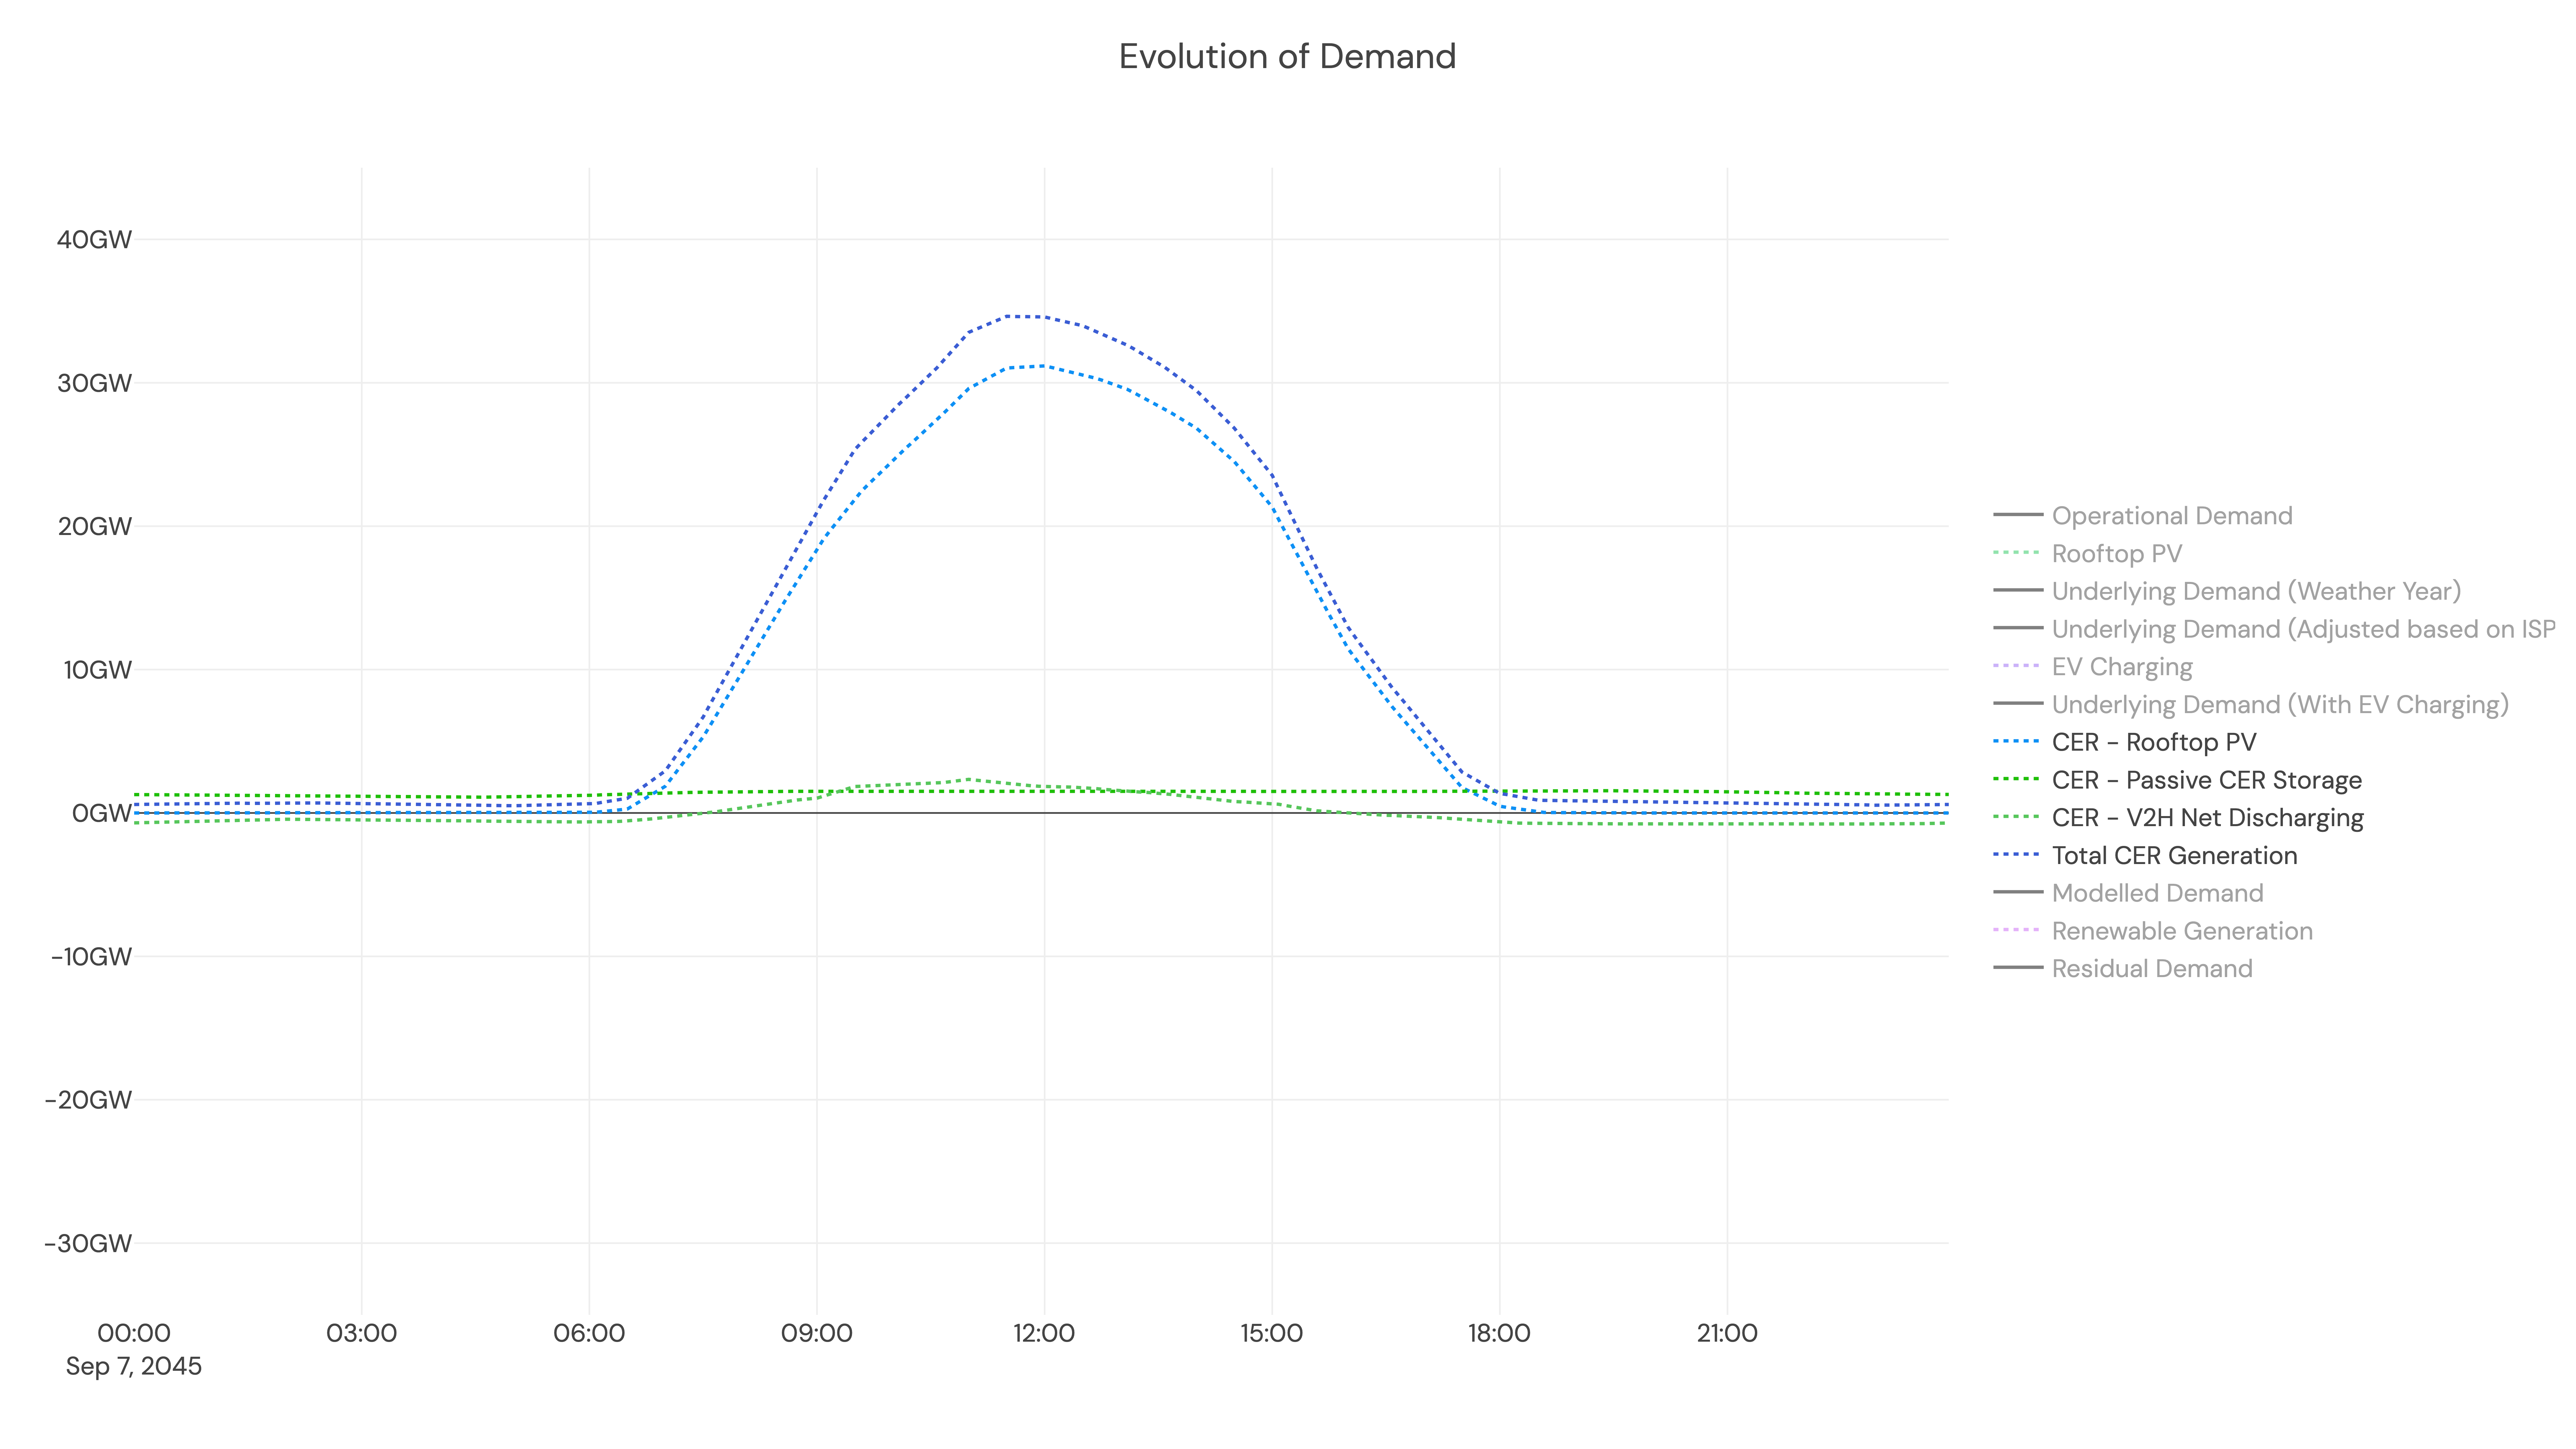
Sum up all the generation from consumer energy resources
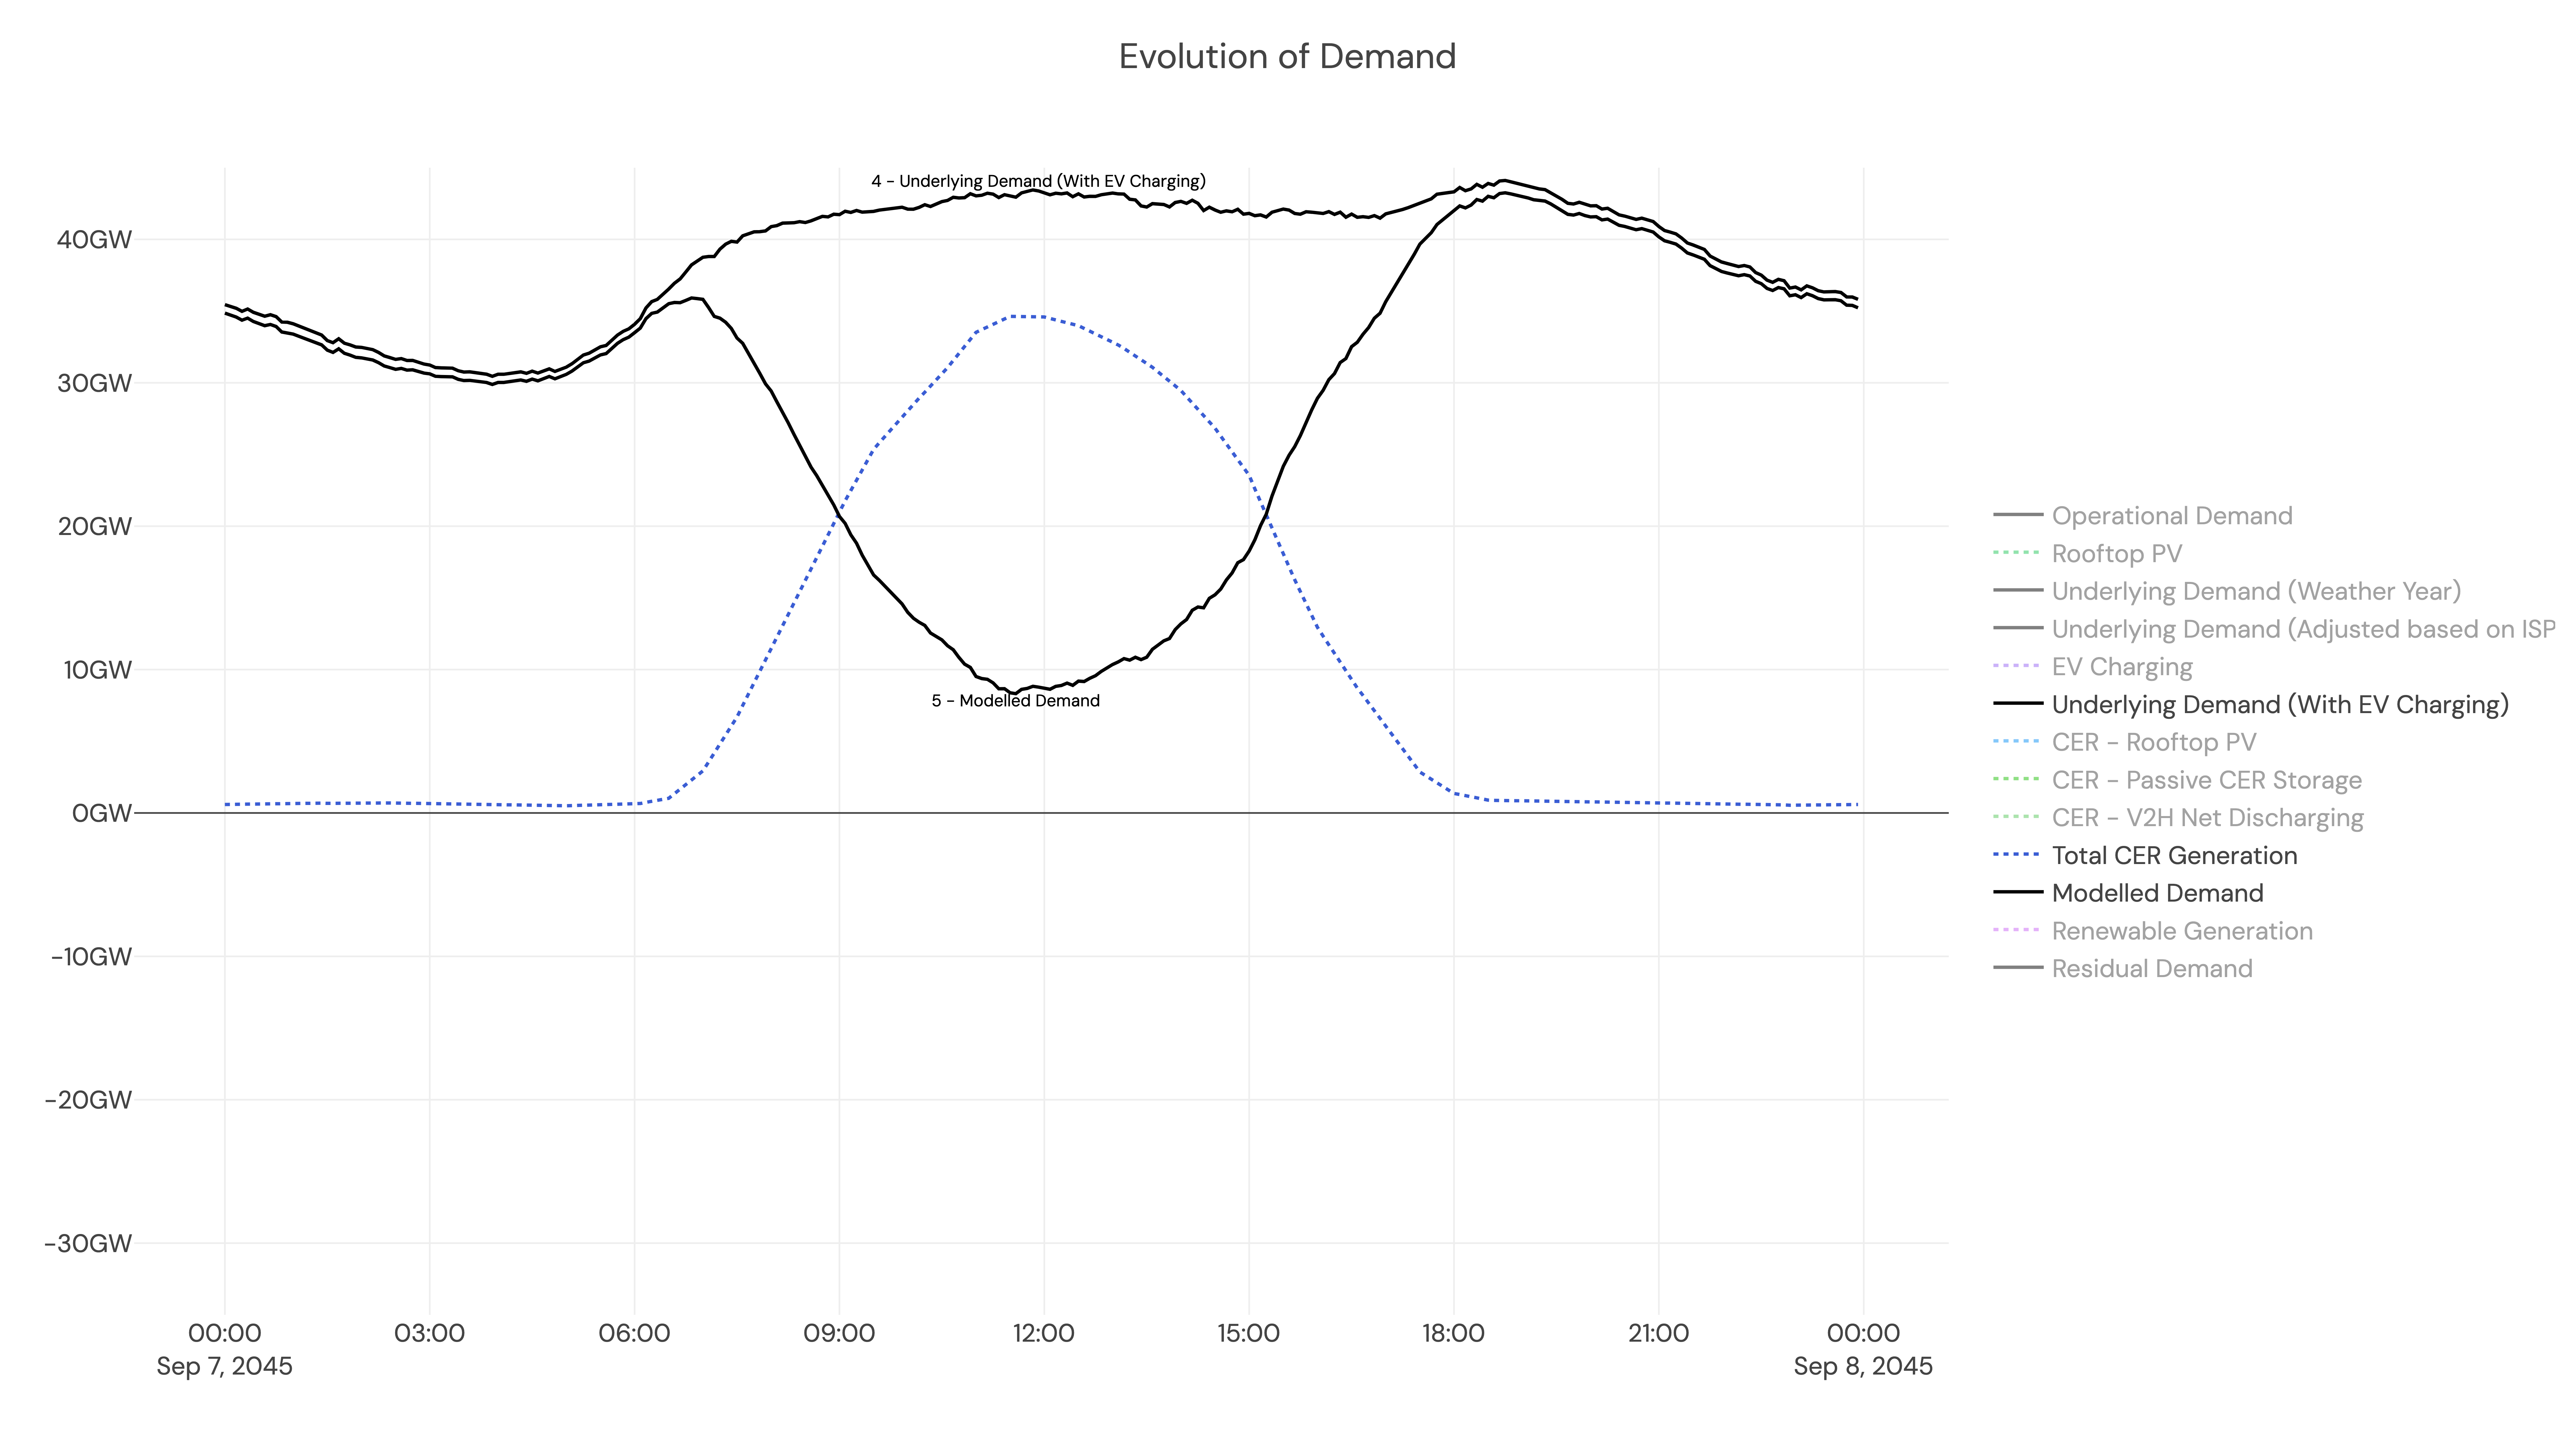
And finally, reduce underlying demand by total CER generation to get the total operational demand for each 5 minute interval
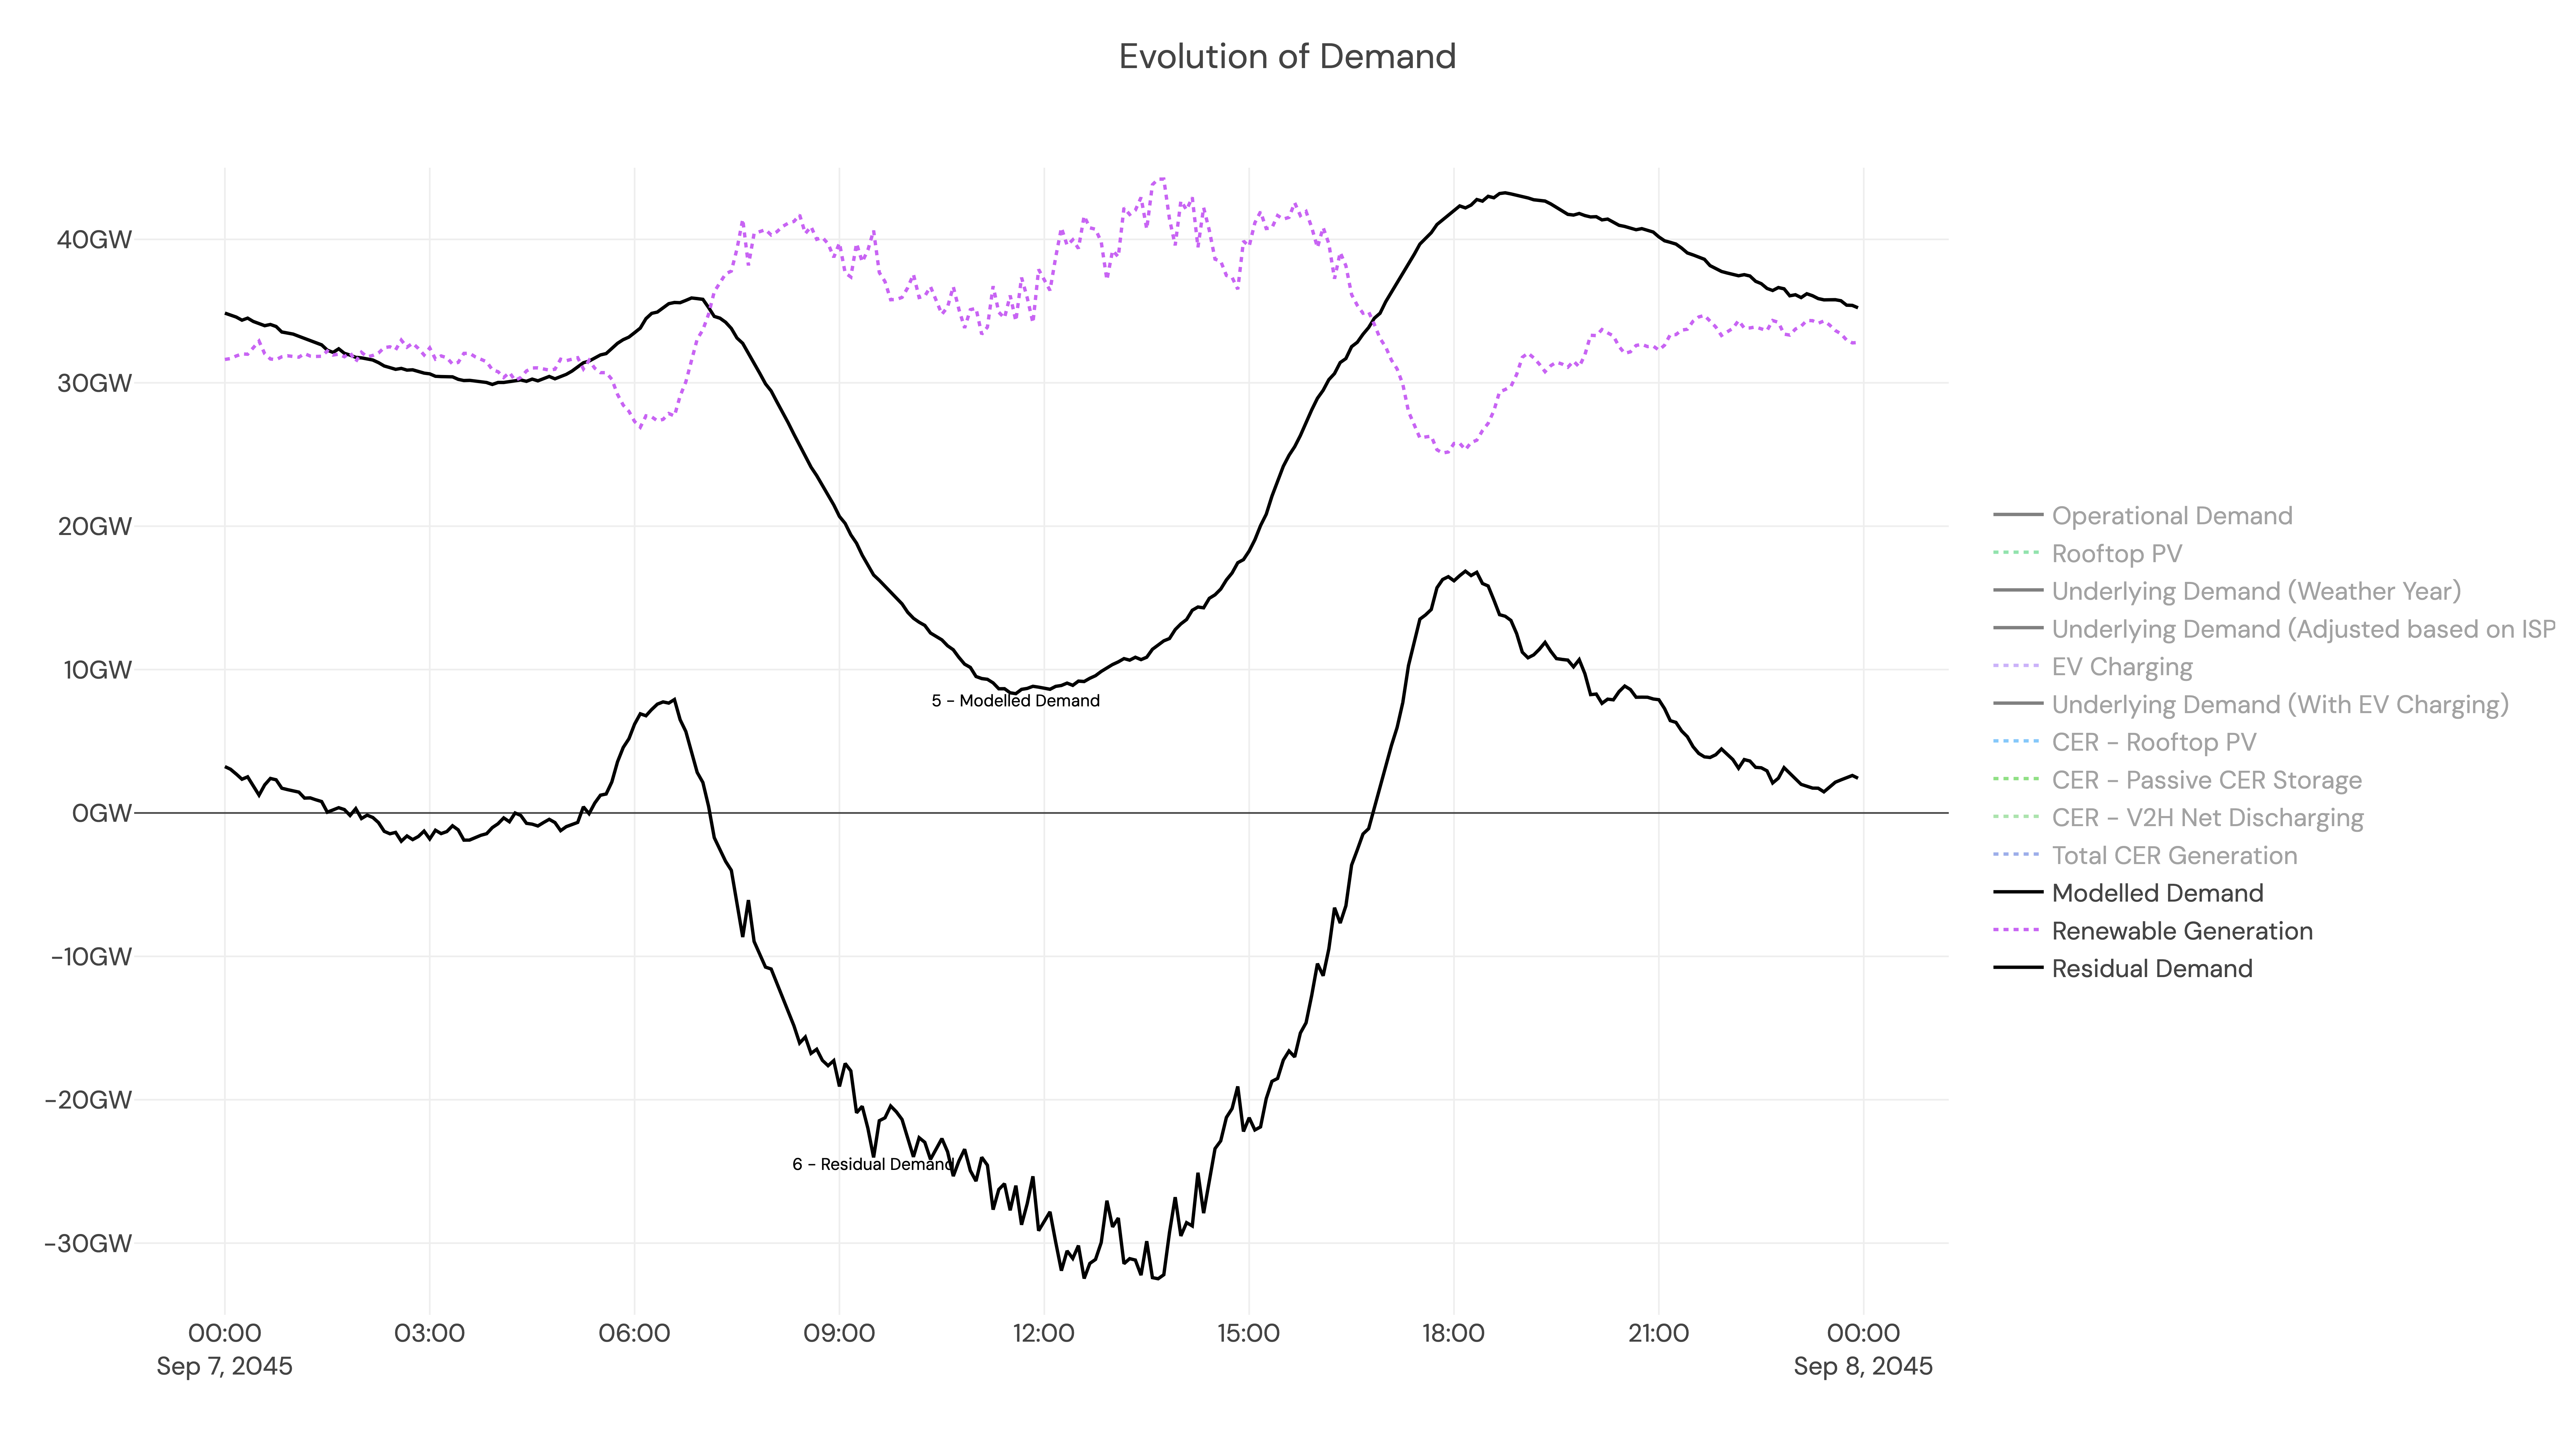
We then subtract the modelled renewable generation to get the residual demand, which must be met by dispatchable generation.
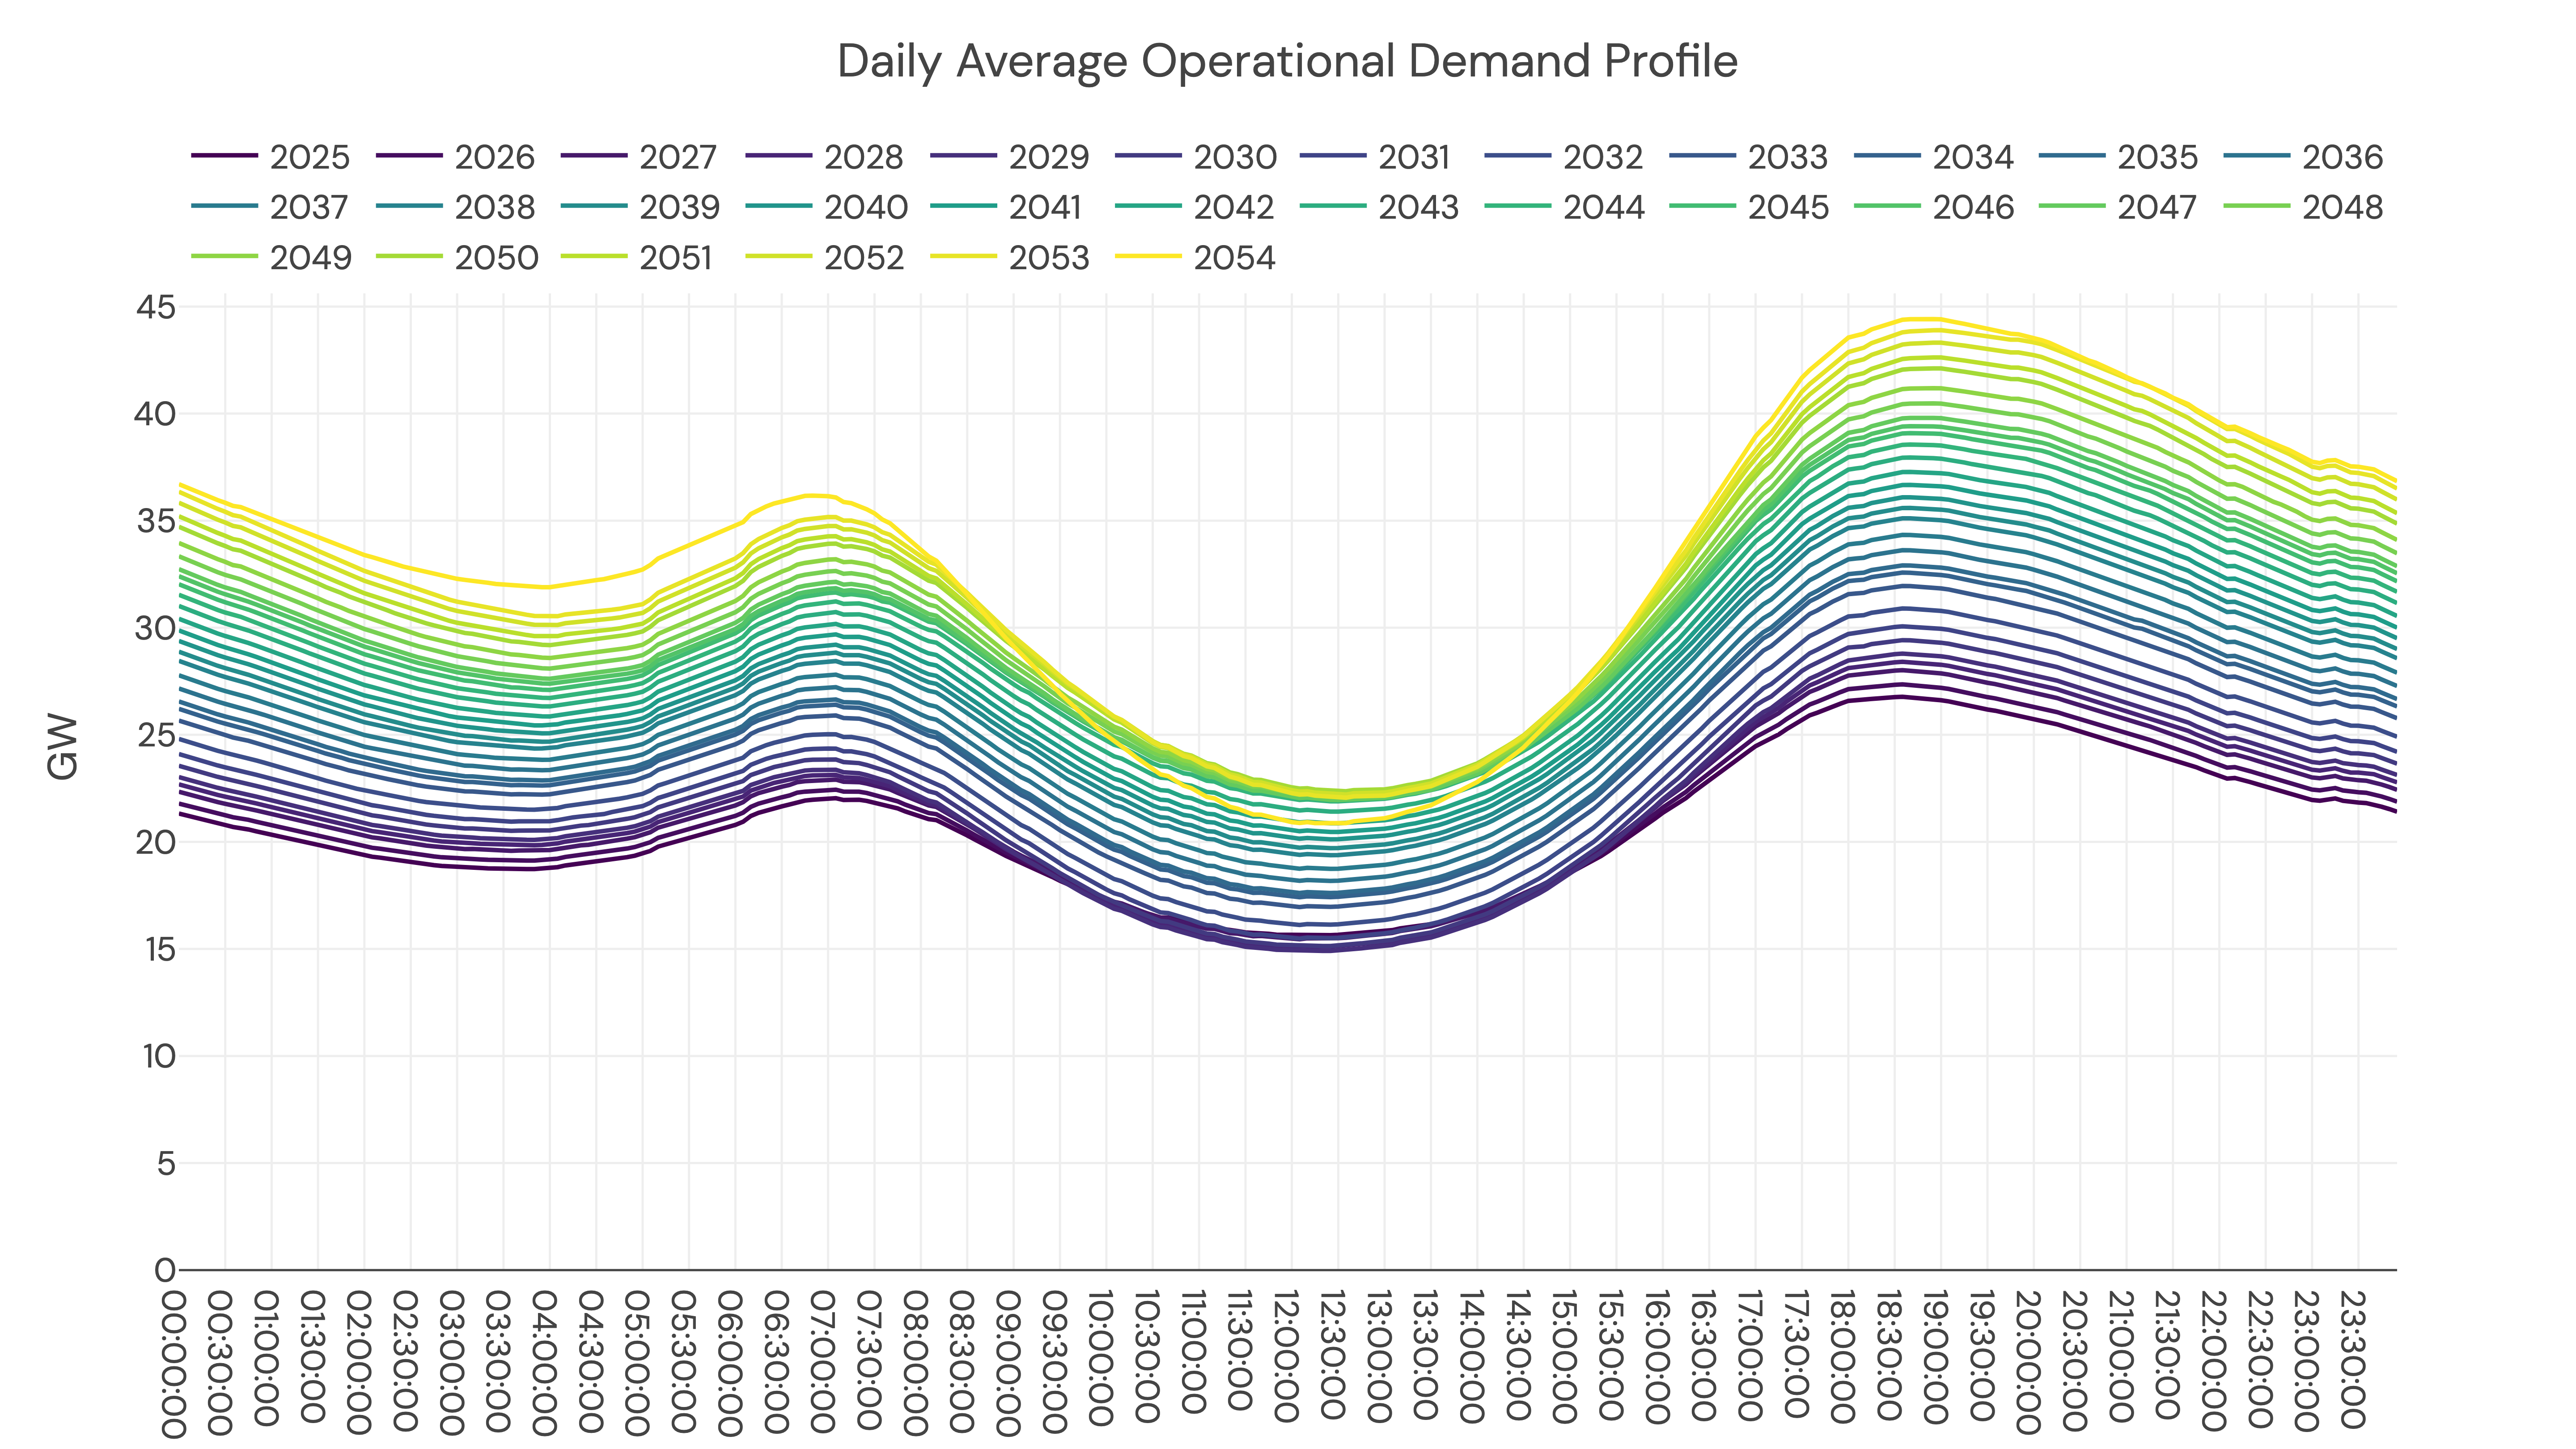
Ongoing forecasted demand
The shape of operational demand will change over time with the buildout of more renewable capacity, particularly solar. As we move into the later years in the forecast horizon, we expect demand to be lower in the middle of the day relative to higher and higher morning and evening peaks, and that the "duck curve" will therefore become more pronounced over time.
Updated about 1 year ago