
Scenario Modelling
Central, low and high scenarios
Our central scenario is what we consider to be the most realistic worldview. However, since the NEM is such a volatile market, there is potential for a lot of variance. To address different scenarios, and differing risk appetites, we also forecast a low and high scenario.
High Scenario
Modo Energy forecasts a 'high' case, assuming a more optimistic battery revenue scenario.
Battery storage buildout
Battery storage buildout is one of the most important sensitivities to the battery business case, as increased buildout results in a suppressive effect on price spreads. There are currently 21GW of BESS projects in the pipeline that we deem to have made tangible progress, which are aiming to be online by end of 2028. The question is, how many of these projects will be built, and when?
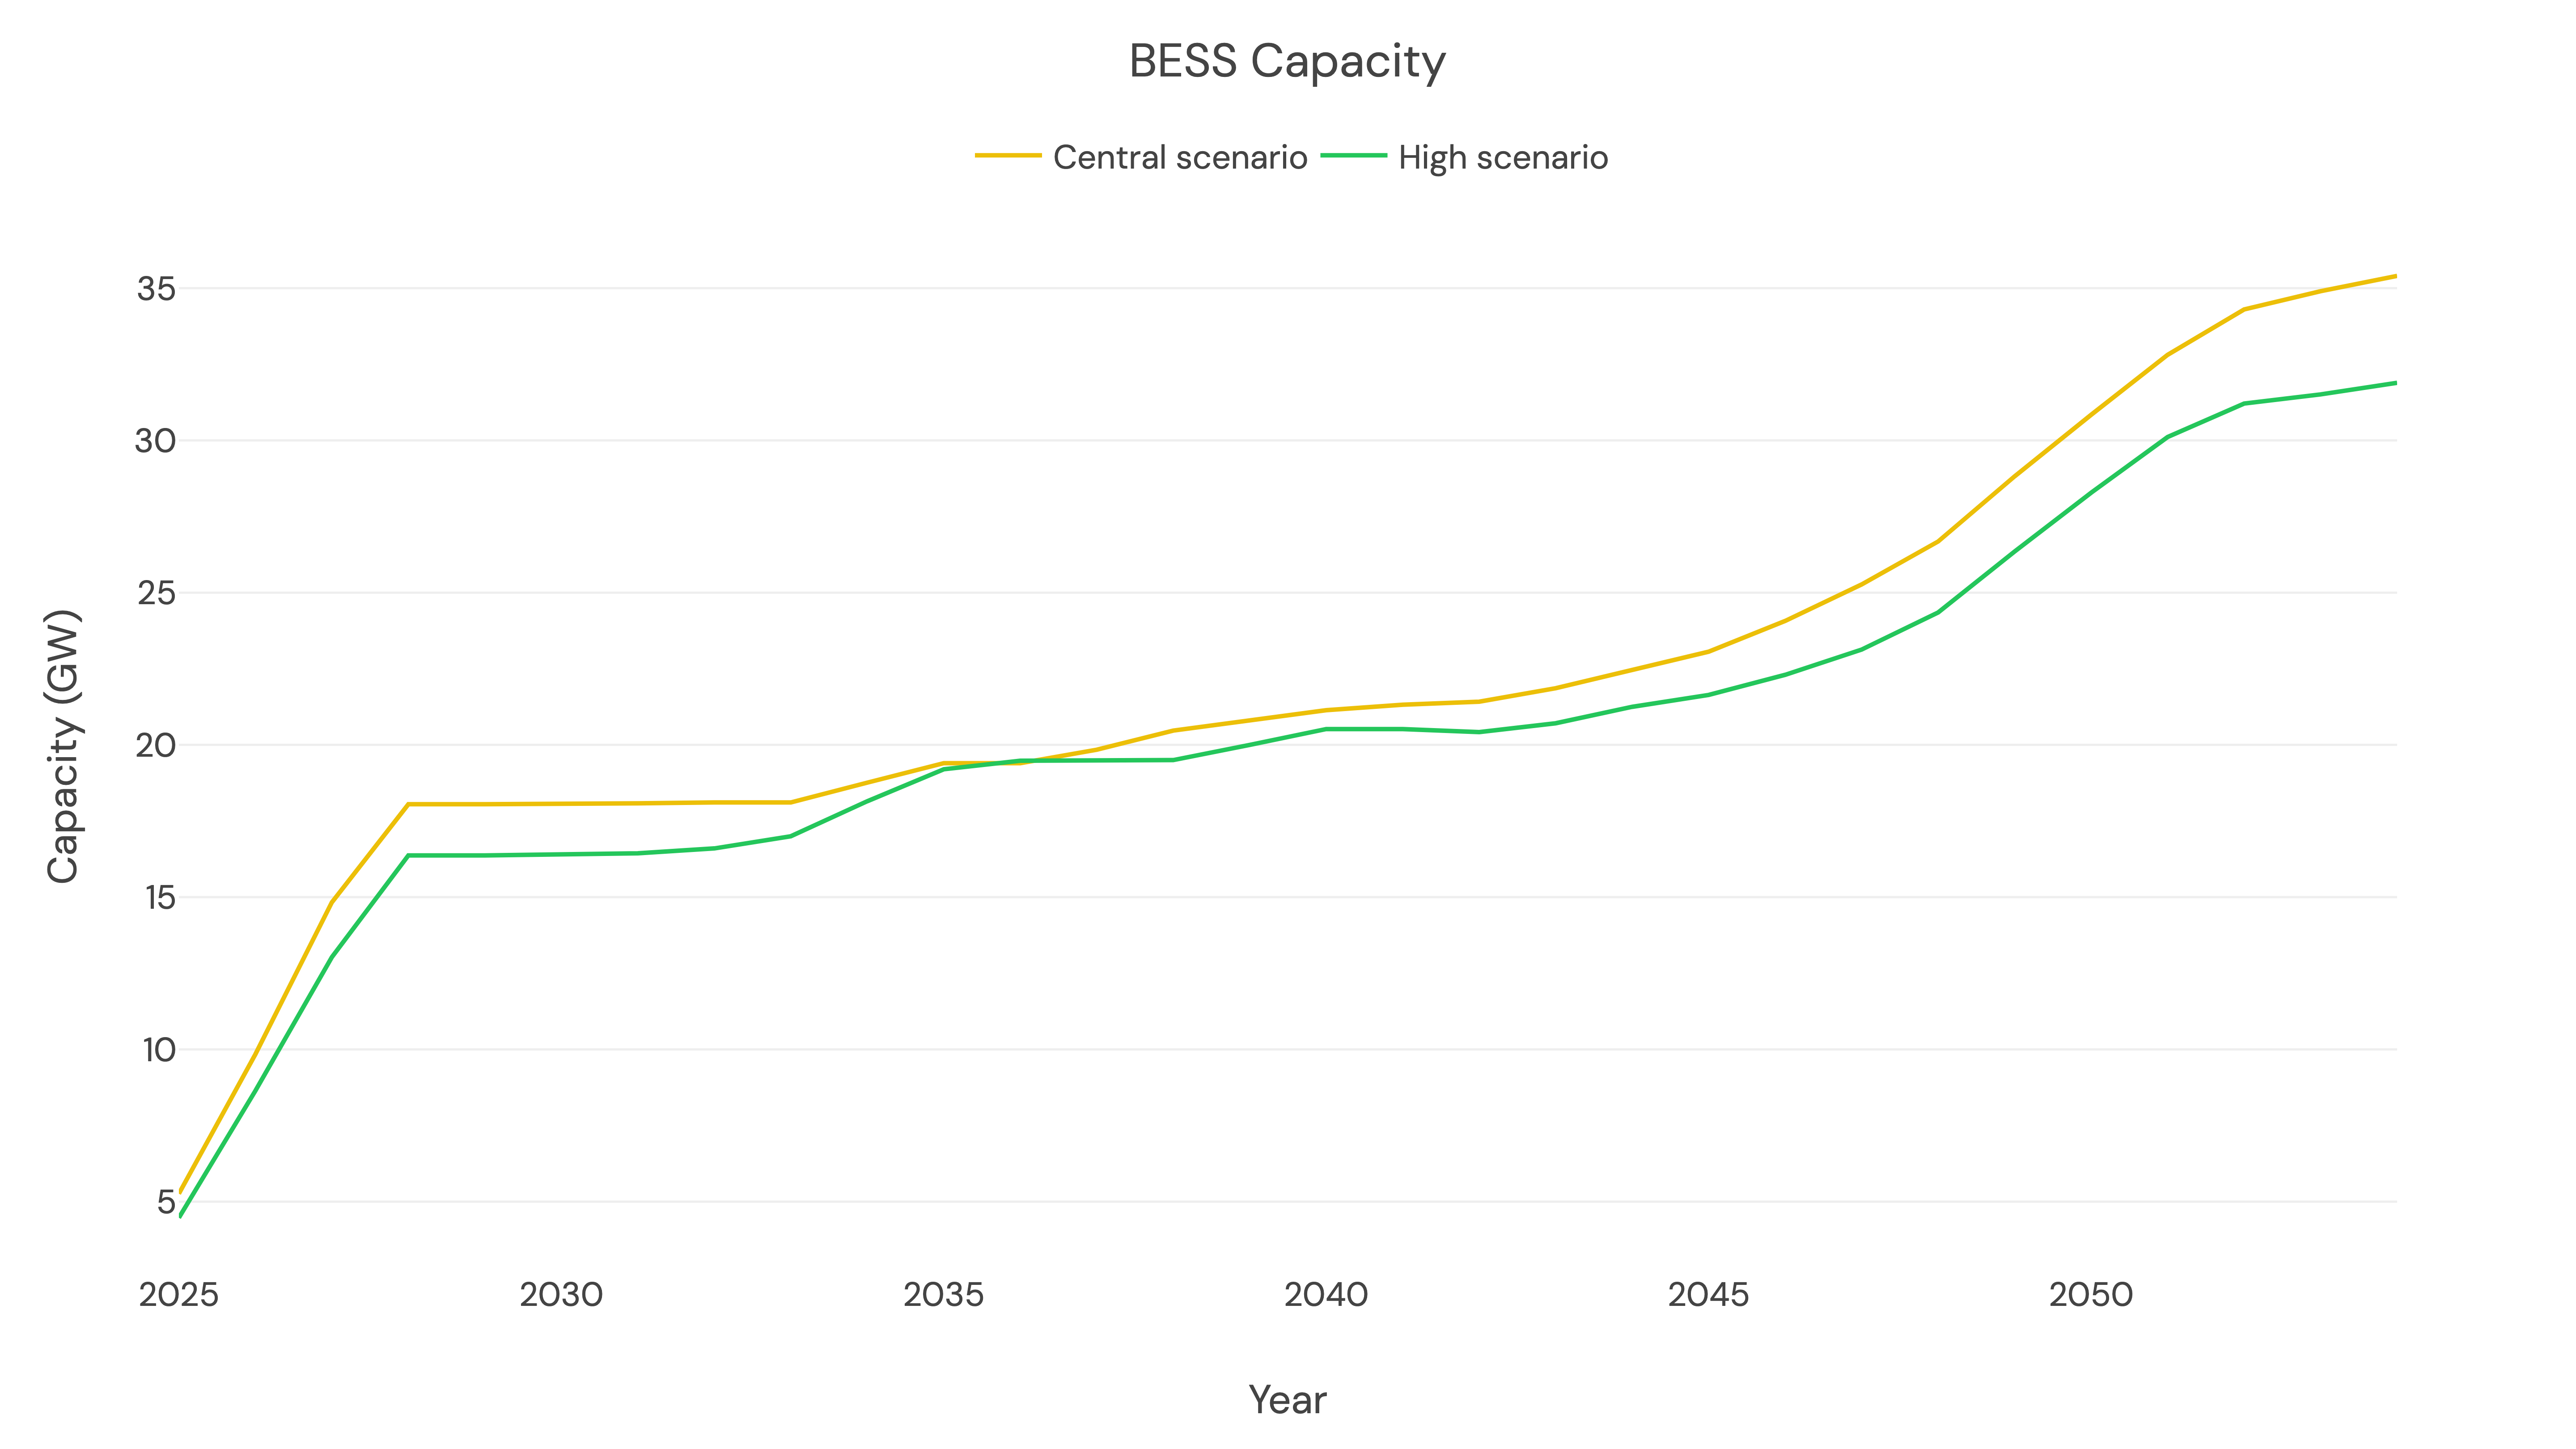
For the high scenario, we have assumed a lower probabilistic total buildout of projects in the pipeline compared to our central scenario, with more and longer delays built into our assumption of when capacity comes online in the near term. We separated battery projects in the pipeline based on project status, and have developed an informed opinion on likely delays and total capacity to come online within each status group based on historical project timelines in the NEM and market expertise, which is indicated in the table below.
Our high scenario has an overall lower battery capacity assumption compared to our central scenario.
Long duration storage project delays
Based on historical trends, we can see that longer duration energy storage will become increasingly important to dampen extreme price peaks, particularly with the increase of solar generation. Therefore, long duration storage project delays will likely have a significant impact on power prices.
For the high scenario, we have assumed a delay of 2 years to the project operational dates for Snowy 2.0 (2030 to 2032), Phoenix Pumped Hydro (2031 to 2033), and Borumba (2035 to 2037).
Capex
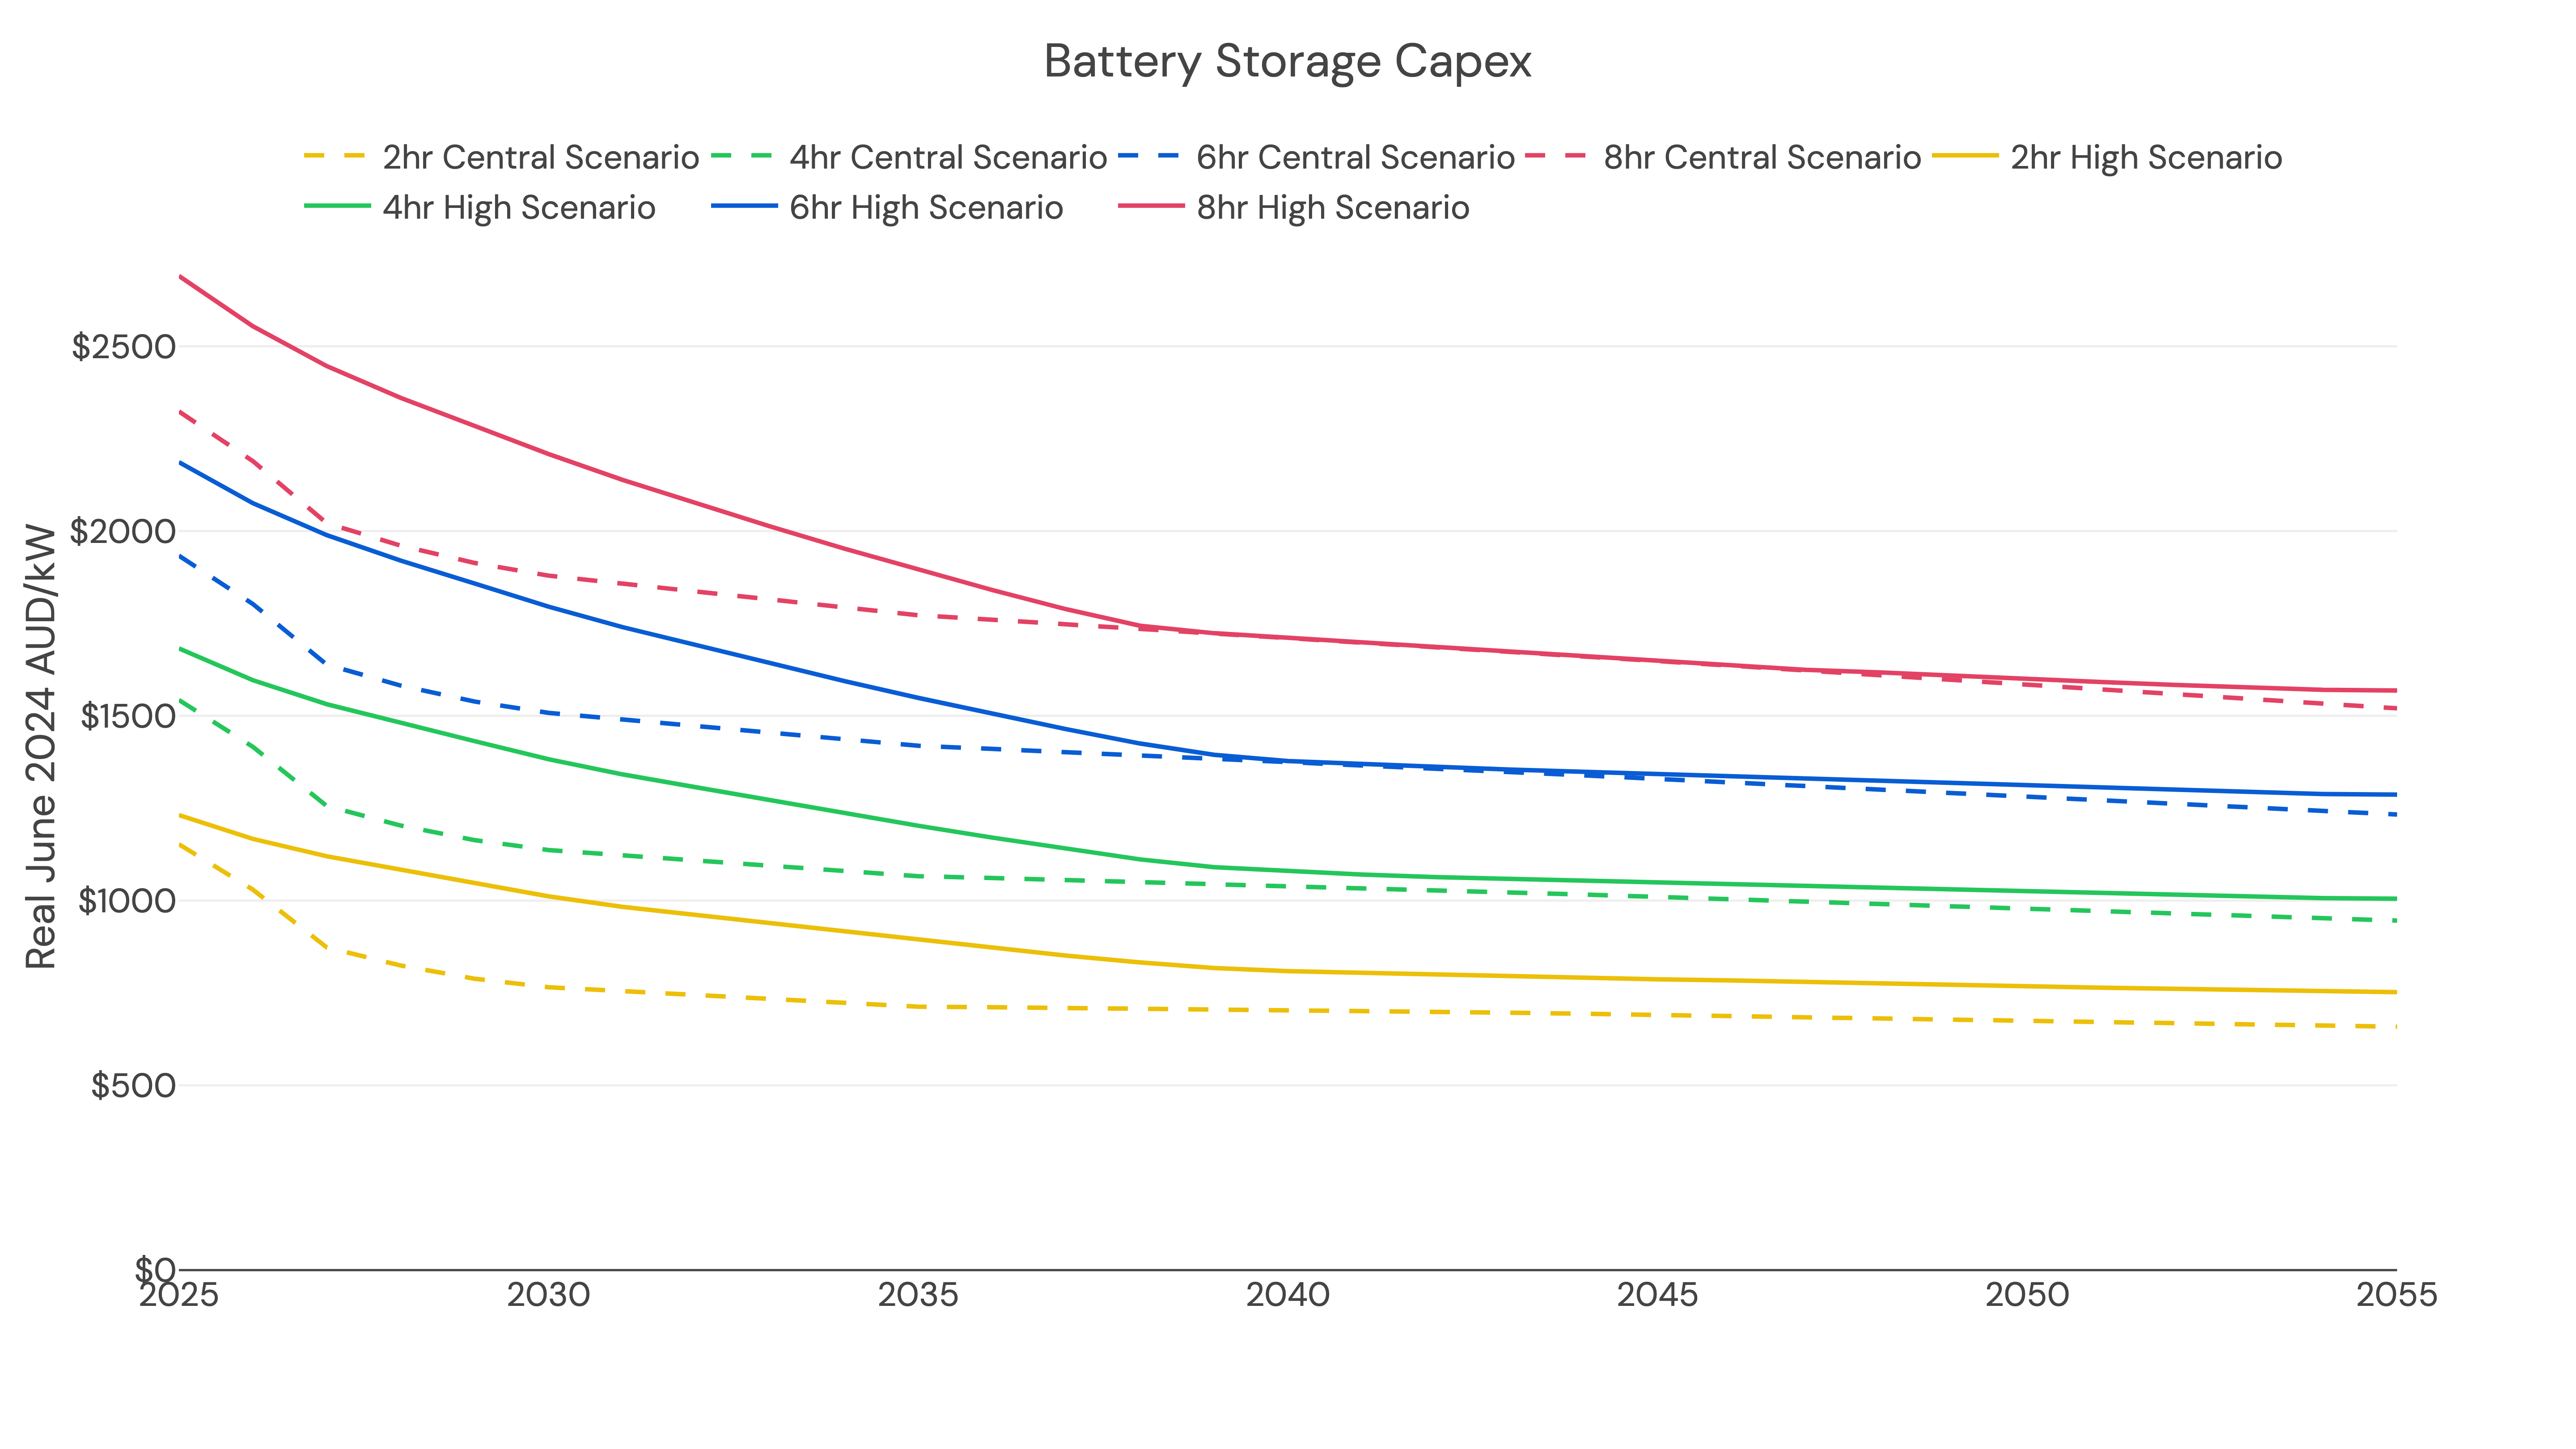
Capex for a particular technology directly impacts the amount of capacity that can operate economically in the market. A higher capex means fewer batteries will be built overall, but also means higher revenues for the battery fleet.
We have assumed a higher capex for BESS, using the CSIRO Gencost 2024/25 figures for the high scenario.
Commodity prices
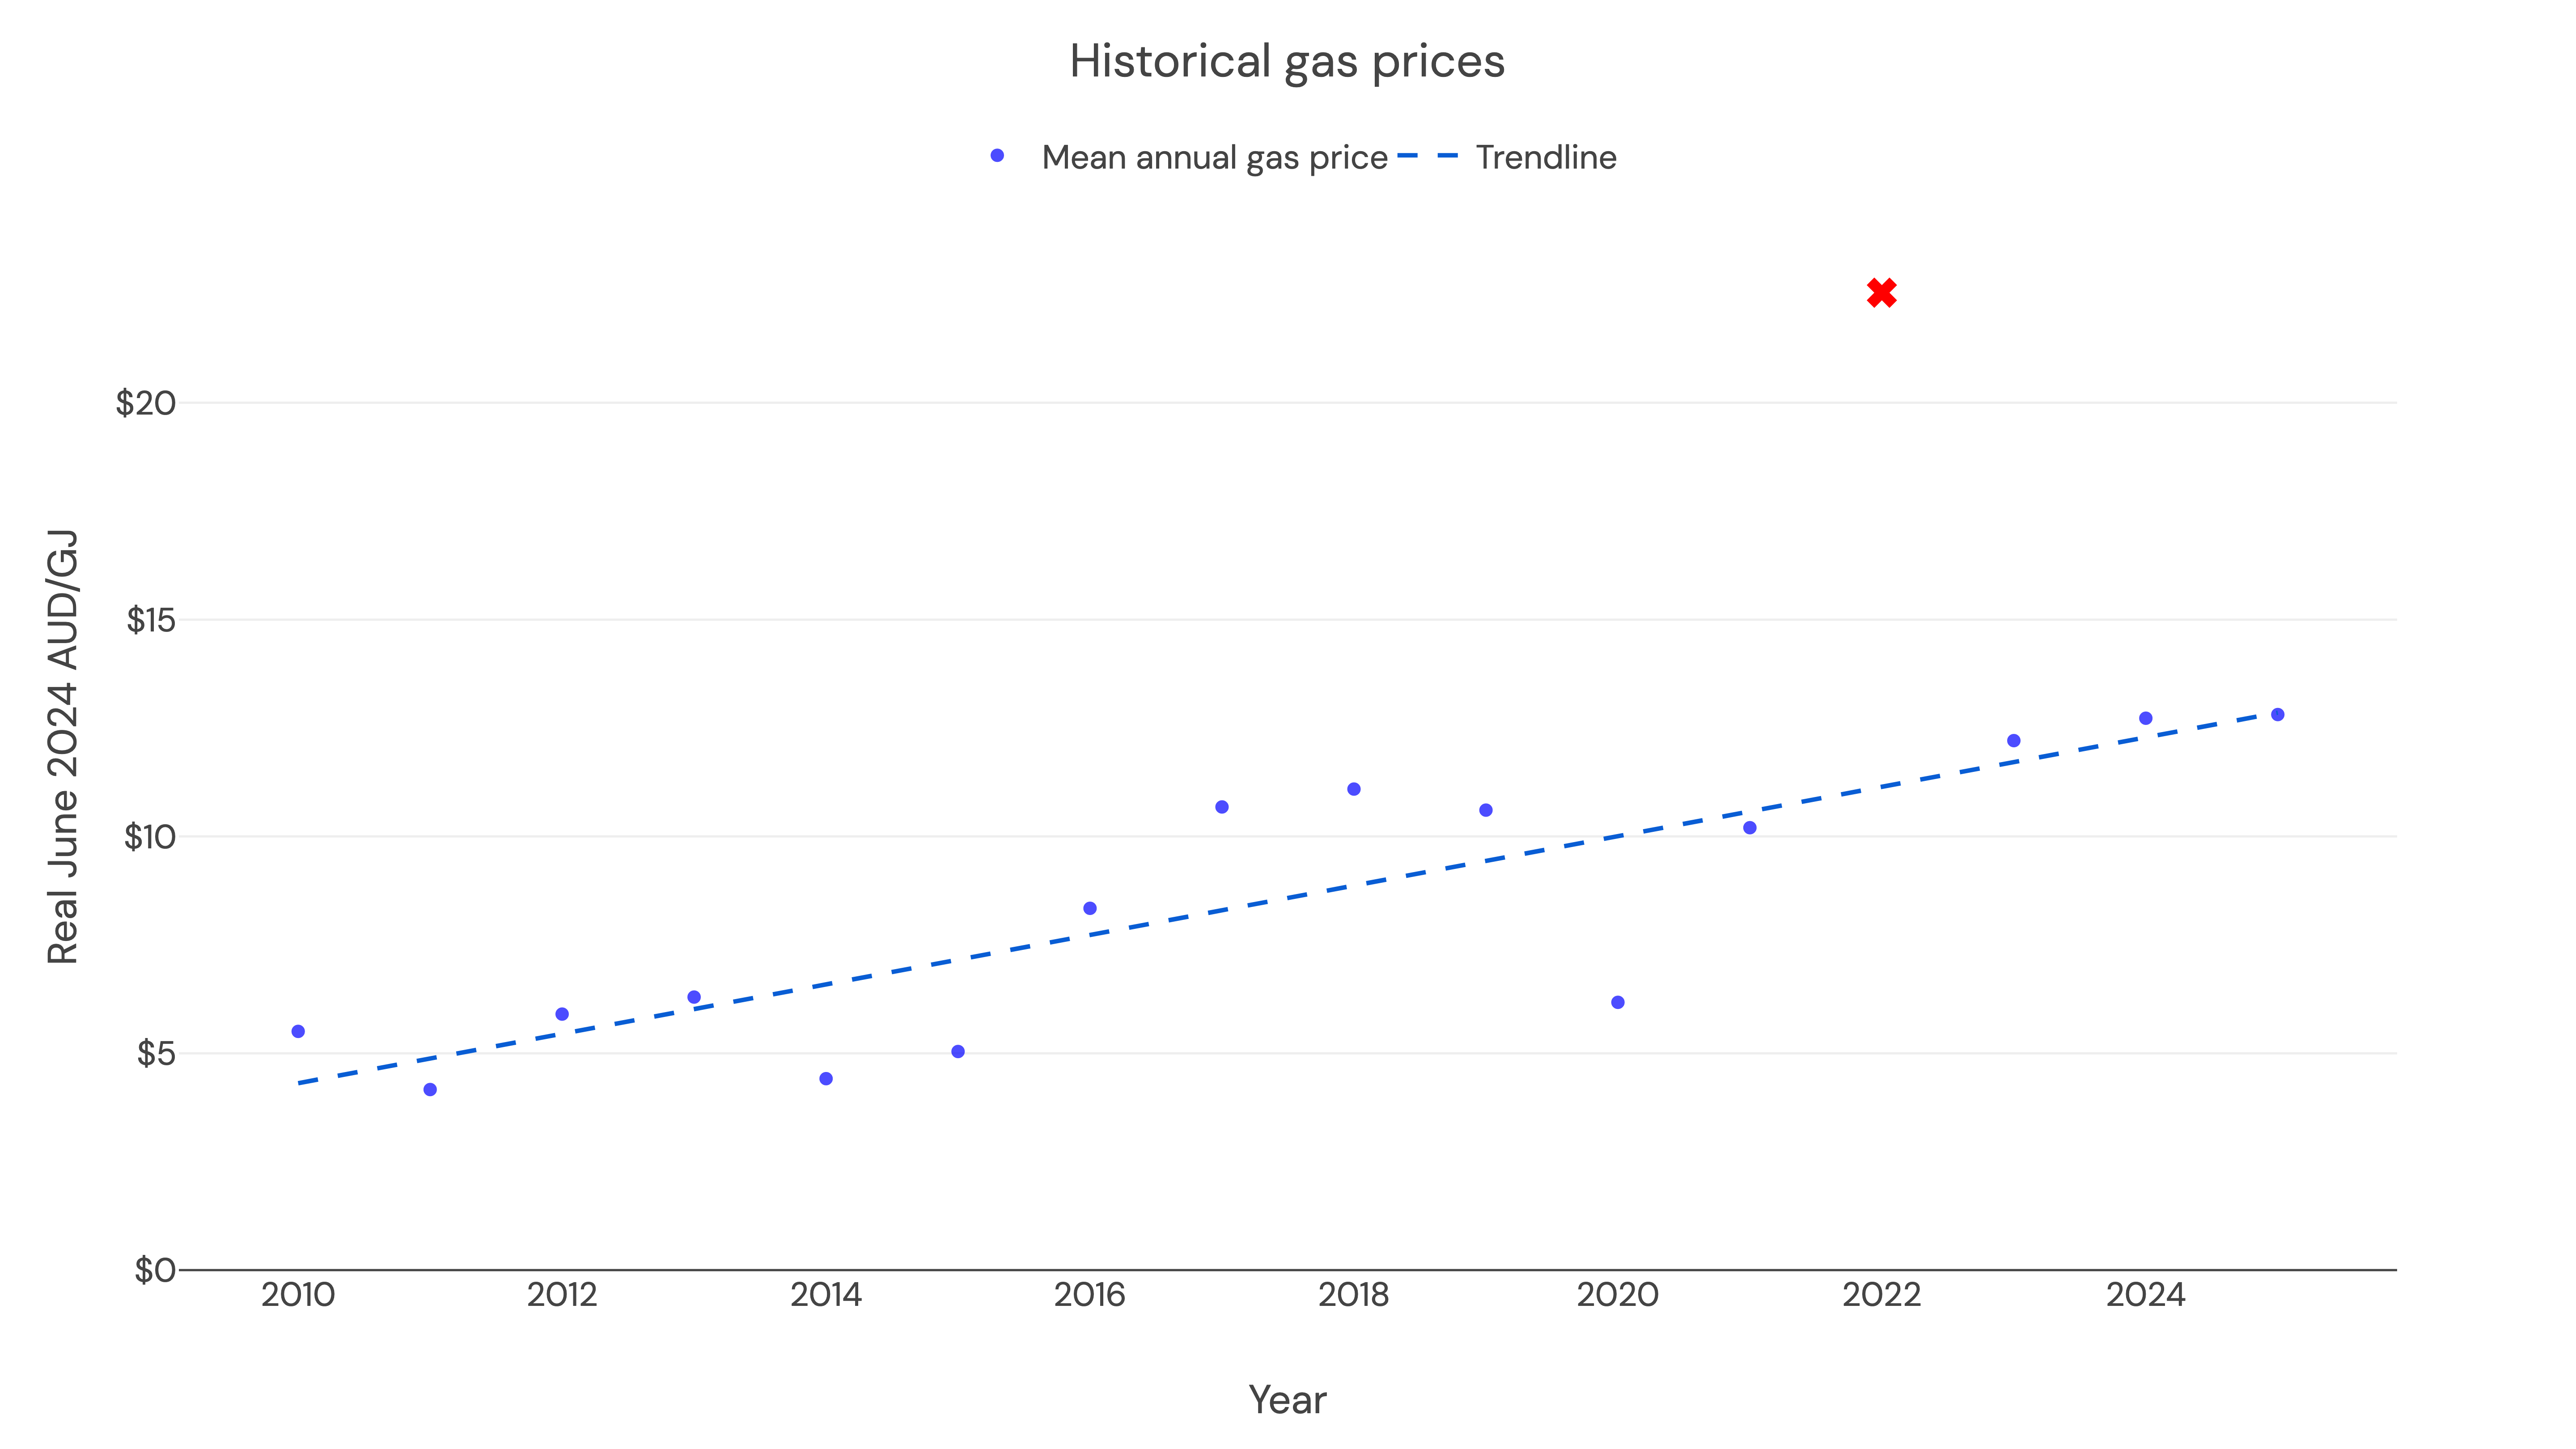
Commodity prices impact the cost of operating thermal generators, which in turn impacts their bids into the market. Since most of the electricity generated in the NEM currently comes from thermal generation, even a small percentage change in commodity prices will impact power prices and spreads.
We have assumed that commodity prices are 13.6% higher than our central scenario. This figure is based on the positive variance of mean annual gas price from 2010 to 2025, after discounting inflation and the long term price trend. We've also chosen to exclude 2022 in calculating this figure as it presents as an outlier in the dataset due to the global energy crisis (see figure). While we recognise that rare events like this may happen again in the future, we believe removing the outlier data point better represents a reasonable best case scenario.
Ageing coal and increasing outages
As previously mentioned, thermal generation makes up a large proportion of all electricity generated in the NEM, but this is even more pronounced in New South Wales, Queensland, and Victoria with a majority of generation coming from coal in these states. Therefore, often when there is a significant coal outage (i.e. a forced outage) this causes a period of volatility.
For the high scenario we've increased the outage rate year on year by the following percentage points.
| State | Percent increase in outage rate YoY (High) |
|---|---|
| New South Wales | 2.32% |
| Queensland | 1.51% |
| Victoria | 2.16% |
We have increased this percentage point figure from the central scenario based on the positive variance of forecasted forced outage rates, after discounting the long term trend. This is to represent the potential upside based on the existing variation in outage rates.
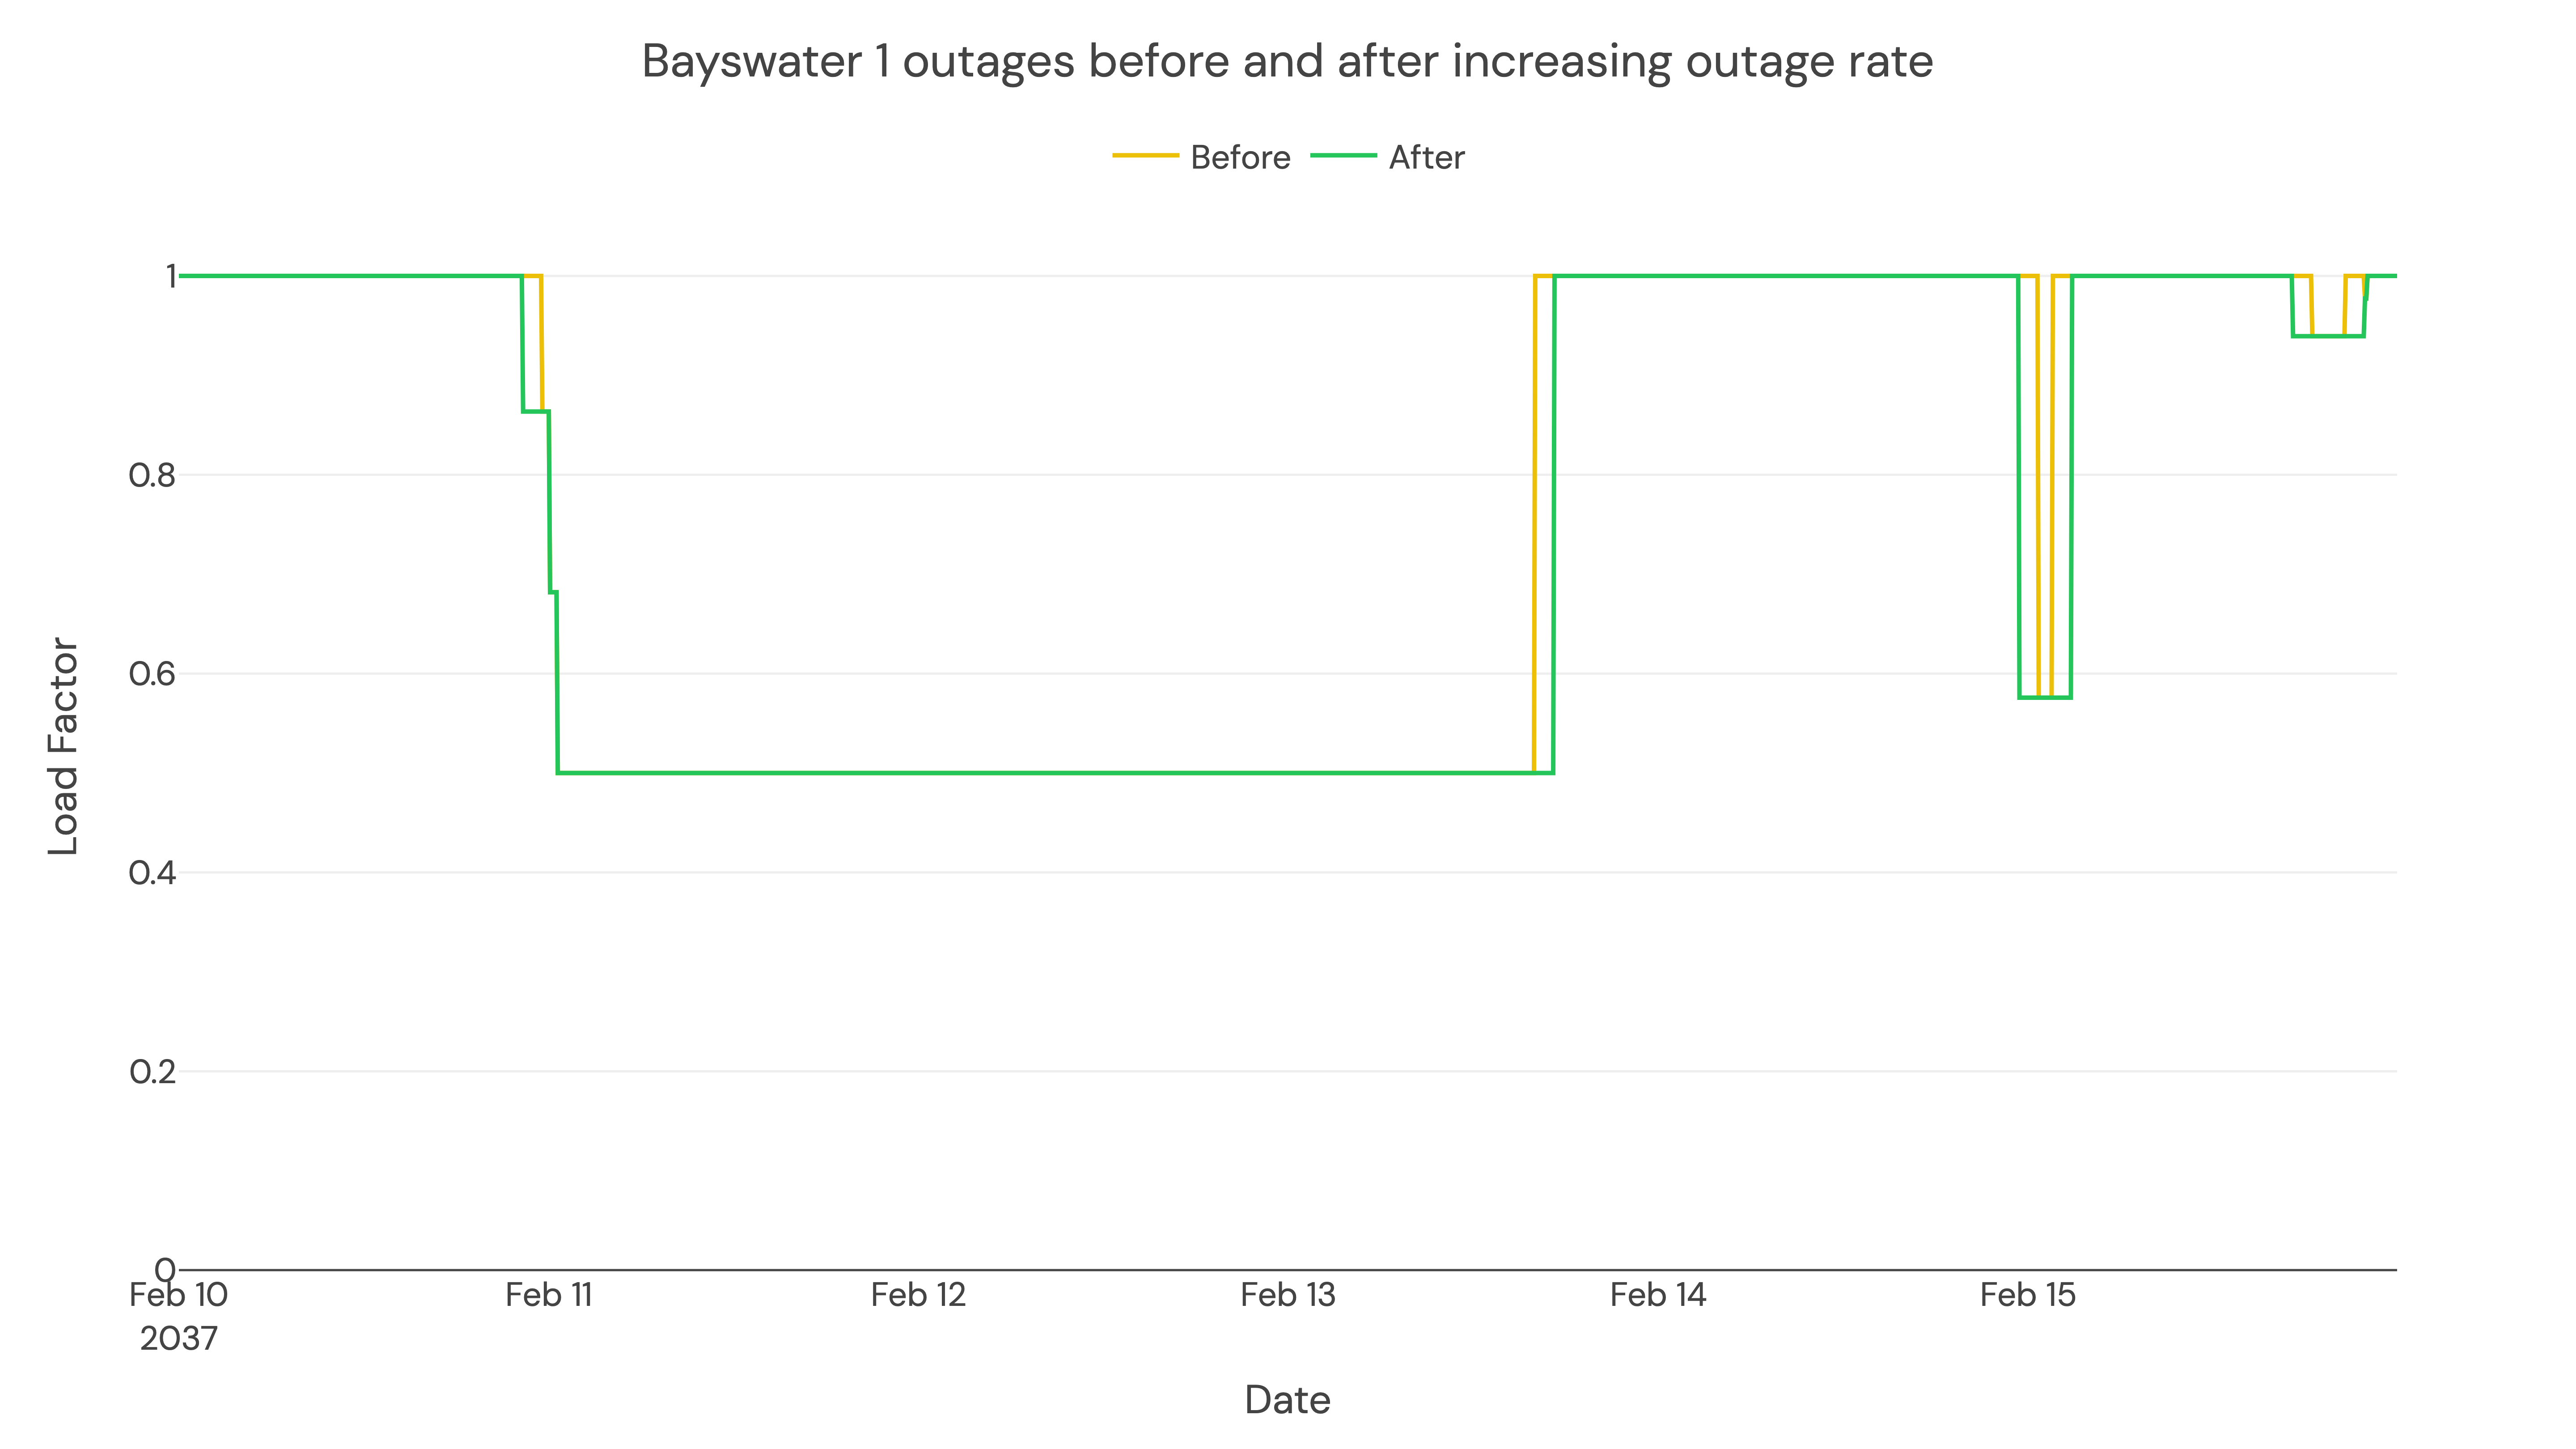
We then extend the existing weather year outages evenly across the year for each generating unit by the number of settlement periods aligning with the increased outage rate for that forecast year.
The chart below demonstrates how this extension is applied on three partial outages for Bayswater unit 1 in 2037.
Low Scenario
Modo Energy forecasts a 'low' case, assuming a more conservative battery revenue scenario.
Battery storage buildout
For the low scenario, we have assumed a higher probabilistic total buildout of projects in the pipeline compared to our central scenario. This results in fewer and shorter delays built into our assumption of when capacity comes online, as well as more capacity coming online overall.
Demand
For our low case, we have assumed a lower data centre buildout using the ESOO 2024 Step Change scenario for the Data Centre demand component, compared to the Data Centre Sensitivity scenario used in the central scenario.
Commodity prices
We have assumed that commodity prices are 8% lower than our central scenario. This figure is based on the negative variance of mean annual gas price from 2010 to 2025, after discounting inflation and the long term price trend.